On July 16, Strategy’s chief executive Phong Le said something that would have been unthinkable from that company eighteen months ago. Asked in a Bloomberg interview when Strategy would resume buying Bitcoin, Le answered with a condition: “When Stretch gets back to par, we’ll issue more. We’ll buy more Bitcoin.”
Stretch — STRC, Strategy’s Variable Rate Series A Perpetual Stretch Preferred Stock — has a stated par value of $100 per share. It traded at $87 on July 15. Le acknowledged in the same interview that he could not say when it would get back to $100.
Read that plainly. The largest corporate holder of Bitcoin in the world — 843,775 BTC, more than BlackRock’s IBIT ETF holds — has publicly subordinated its Bitcoin accumulation to the market price of one of its own yield instruments. Not to Bitcoin’s price. Not to a macro trigger. To a preferred stock trading 13% below the peg its own dividend policy is supposed to defend.
This is not a detail for capital-structure enthusiasts. For four years, the single most reliable bid under the Bitcoin market was Michael Saylor’s company converting every dollar it could raise into coins, on any terms, in any conditions. That bid is now formally gated. And the gate has a design flaw that deserves to be stated precisely: the dividend that is supposed to lift STRC back to $100 is funded, in part, by selling Bitcoin.
A Peg Without a Peg’s Defenses
To see why the condition matters, you have to understand what STRC was built to do.
Stretch is a perpetual preferred that pays cash dividends semi-monthly — a payment cadence chosen deliberately to make it feel like a money-market instrument rather than an equity security. Its dividend rate is adjusted monthly, and the stated purpose of those adjustments is to steer the market price toward $100. Trade below par, and the company raises the rate to attract buyers; trade above, and it can ease off. Strategy held the rate at 11.5% for four consecutive months through the spring while pushing to defend the $100 level. Effective for record dates on or after July 1, the company raised it again — to 12.00% per annum, or $0.50 per share every half-month.
The instrument’s economic function, in the design Strategy laid out to investors, was to be a perpetual-motion funding machine: sell new STRC shares into the market whenever the price sits at or near $100, and convert the proceeds immediately into Bitcoin. Par is not a vanity metric. Par is the condition under which the machine can issue new shares without handing new buyers a discount at existing holders’ expense. Below par, issuance is dilution at a markdown; the machine stalls.
The machine is stalled. STRC sat at $87 on July 15, roughly 13% under its stated amount, even after the dividend was lifted to 12%. A 12% coupon that leaves the instrument stuck in the high $80s is not a peg defense. It is a market telling you what it thinks the paper is worth from an issuer whose common stock has lost roughly three-quarters of its value in a year and whose Bitcoin position is underwater by around $9 billion against an average cost of $75,476.
Eighteen Days
Le’s July 16 statement is the third act of a sequence that took less than three weeks to play out. Put the filings in a row and the shape of the new Strategy is unmistakable.
June 29 to July 5: Strategy sold 3,588 BTC for approximately $216 million — an average of roughly $60,200 per coin, some $15,000 below the company’s own average acquisition cost. The sale consumed about 17% of the $1.25 billion Bitcoin-sale authorization the board had announced only days earlier, a program we examined when it was unveiled. The stated purpose: fund preferred dividends and bolster corporate liquidity. Bitcoin fell nearly 3% on the disclosure; MSTR opened down roughly 6%.
July 6 to July 12: Strategy sold 4,818,781 Class A common shares through its at-the-market program, raising approximately $466.7 million. It bought no Bitcoin with the proceeds. It sold no Bitcoin either. The cash went to the USD reserve, which now stands at $3.0 billion. We covered that week’s 8-K when it landed: an equity raise of nearly half a billion dollars, executed by the most famous Bitcoin accumulator in corporate history, that resulted in zero Bitcoin.
July 16: Le supplies the doctrine that explains the behavior. No Bitcoin purchases until STRC reclaims $100. Preferred-holder liquidity now ranks explicitly ahead of accumulation. The company that spent 2024 and 2025 telling investors that every capital-markets instrument it invented existed to buy more Bitcoin now tells them the reverse: Bitcoin exists, at the margin, to service the instruments.
Each of these steps was individually defensible, and Strategy defended each one. Together they describe a company whose famous flywheel — issue securities, buy Bitcoin, let the Bitcoin premium support the securities, issue more — is not merely paused but running in reverse. Securities are being serviced by Bitcoin sales. Equity is being converted to dollars, not coins. And the restart condition has been outsourced to a market price the company does not control.

The Circle
Here is the design flaw, stated as a chain of dependencies that Strategy itself has now made explicit.
For Strategy to buy Bitcoin, STRC must reach $100. For STRC to reach $100, income buyers must believe the 12% dividend is durable and the issuer is sound. For the dividend to be paid, Strategy needs roughly $1.5 billion a year across its preferred stack — our estimate from the June coverage of its dividend obligations — from a software business that has never generated a fraction of that in free cash flow. So the dividend is funded from the balance sheet: from the $3 billion USD reserve, from common-stock sales, and — since the week of June 29 — from selling Bitcoin below cost.
But every Bitcoin sale advertises the fragility that keeps STRC below par in the first place. The instrument’s buyers are being asked to price a 12% perpetual claim against a collateral pool the issuer has begun liquidating at a loss to pay them. The more visibly Strategy sells assets to defend the dividend, the more rational it is for a preferred buyer to demand a discount to par as compensation for issuer risk. The discount keeps STRC under $100. STRC under $100 keeps the Bitcoin bid switched off — by the CEO’s own stated rule.
There is a name for a peg whose defense mechanism erodes the confidence the peg depends on. Crypto-native readers lived through several of them in 2022. It would be hyperbole to call STRC a death spiral — Strategy has real assets, a real cash reserve, and no near-term maturity wall forcing its hand. But it is not hyperbole to observe that the company has wired its most bullish possible action (buying Bitcoin) to a gauge (STRC’s price) that its most bearish necessary action (selling assets to pay dividends) pushes in the wrong direction. Phong Le did not describe an exit from the corner. He described the corner.
The Tape Didn’t Blink — and That’s the Story
What did the Bitcoin market do with the news that its largest single accumulator has formally conditioned its return? Approximately nothing. Bitcoin traded at $64,734 on July 16, down 0.34% on the day.
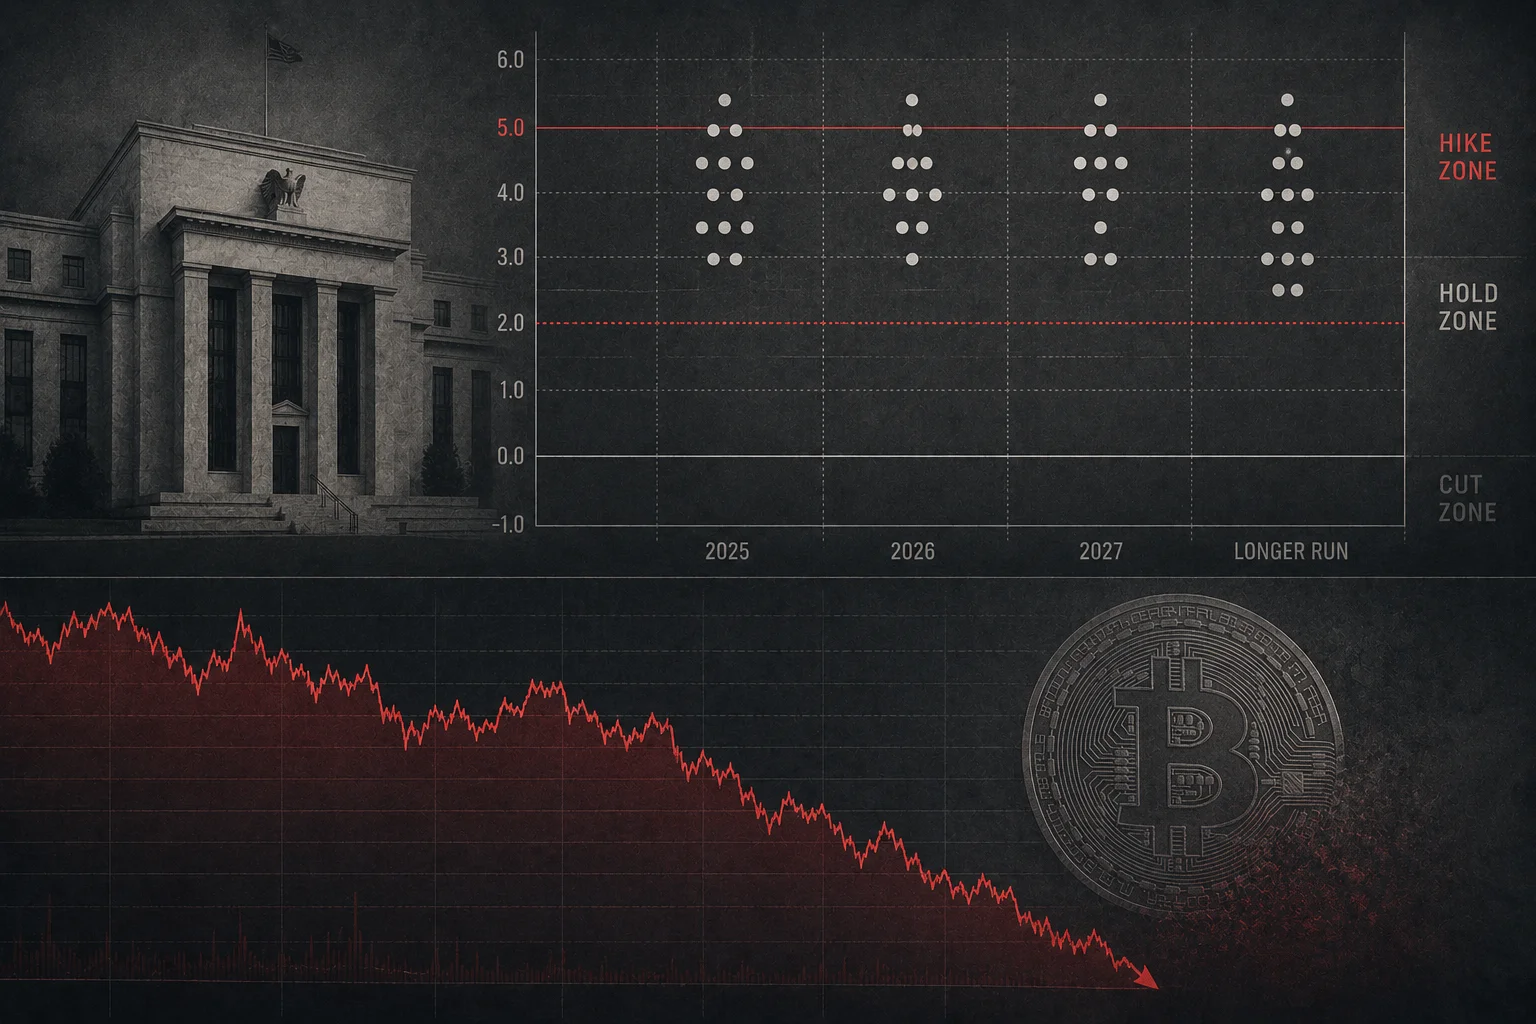
That indifference is more damning than a selloff would have been, because the macro backdrop this week was the friendliest it has been all year. June CPI printed a 0.4% monthly decline — the largest monthly drop since April 2020 — gutting the case for aggressive Federal Reserve tightening. Spot Bitcoin ETFs finally broke their outflow streak, pulling in about $108 million on July 15, led by BlackRock’s IBIT at $80.8 million. Set against June’s $4.5 billion in ETF outflows, the sharpest monthly exodus on record — which we documented as it happened — one hundred million dollars of daily inflow is a rounding-error reversal, not a regime change.
This is the pattern we identified in our July 14 analysis of the CPI print and Strategy’s passive week, and it has only hardened since: the macro dial moved, and institutional demand did not. Three days after that piece ran, the demand side of the ledger has deteriorated further in kind if not in degree — because “Strategy is not buying this week” has been upgraded, by the CEO, to “Strategy will not buy until a condition it cannot control and cannot date is satisfied.”
The Marginal Buyer Problem
Why does one company’s purchasing policy matter to a $1.3 trillion asset? Because Bitcoin’s 2024–2025 bull structure was built on a specific story about who the marginal buyer was: ETFs channeling institutional allocation, corporates emulating Strategy’s treasury model, and — after March 2025 — the prospect of the United States government itself accumulating under the Strategic Bitcoin Reserve executive order.
Audit that list as of July 17, 2026. The ETFs bled $4.5 billion in June and have managed one week of modest inflows on a soft CPI print. The corporate-treasury cohort’s founding company and largest member is now a conditional seller — 17% of a $1.25 billion sale authorization used in its first week of operation. And the Strategic Bitcoin Reserve, sixteen months after the executive order, remains a filing cabinet: Bloomberg reports Treasury and Commerce are still fighting over which department should house it, no open-market purchase has been confirmed, and the legislative vehicles have moved backward — Representative Begich’s rebranded American Reserve Modernization Act quietly dropped the one-million-coin purchase target that made the original BITCOIN Act headline-worthy, substituting a 20-year lockup of coins the government already seized.
Every leg of the institutional demand story is now impaired, deferred, or conditional. That does not make Bitcoin’s price collapse; at $64,000-and-change it is holding a level. It makes Bitcoin’s price macro-hostage — a rates trade in a costume — which is precisely the condition its institutional evangelists spent three years insisting it had outgrown. Saylor himself has pivoted from accumulation to advocacy, spending July touting a new Bitcoin Banking Adoption Index. Indexes measure adoption. They do not bid for coins.
The Case for Phong Le
Steel-man the company’s position, because there is a genuinely strong version of it.
First: this is what responsible liability management looks like. Strategy carries a preferred stack with senior cash claims, and honoring those claims ahead of discretionary asset purchases is not a scandal — it is the covenant hierarchy working as designed. The companies that destroy themselves in a drawdown are the ones that keep leveraging into it. Pausing purchases, building a $3 billion cash reserve, and selling a modest 0.4% of holdings to cover obligations is textbook de-risking, and preferred holders raising concerns about cash coverage were owed exactly this response.
Second: the STRC condition is not arbitrary — it is the economically correct trigger. STRC at par is the market signal that Strategy’s cost of preferred capital has normalized. Issuing new preferred below par to buy Bitcoin would be value-destructive on its face: selling a 12% perpetual claim at a 13% discount is expensive money by any measure. “We’ll buy when Stretch is at par” is another way of saying “we’ll buy when the market will fund us on sane terms,” which is what a disciplined CFO’s office should say.
Third: the scale argument. 3,588 BTC against 843,775 held is a 0.4% trim. The remaining sale authorization, even fully used, covers roughly a year of preferred dividends without touching the strategic position. MSTR is down 75% in a year, but the company has no imminent debt maturity forcing liquidation, and the semi-monthly dividend cadence on STRC gives management a fast feedback loop to adjust rates. This is a liquidity bridge, not a fire sale.
Fourth: the circularity critique can be overdone. Dividend-defending asset sales only spiral when the market believes the asset base is inadequate. Strategy’s Bitcoin stack is worth roughly $55 billion at current prices against dividend obligations two orders of magnitude smaller annually. A rational preferred buyer can absolutely conclude the 12% coupon is safe, bid STRC to par, and restart the machine.
All of this is fair, and none of it rescues the thesis that matters for the Bitcoin market. The steel-man is an argument that Strategy is behaving prudently. It is not an argument that Bitcoin retains its marginal buyer. Indeed, the stronger the prudence case, the worse the market-structure conclusion: if the correct, disciplined, covenant-respecting posture for the world’s largest corporate holder is to sell coins below cost and gate all future buying on its own preferred-stock price, then the treasury-company model — the model half a cycle of corporate adopters was sold on — does not produce a durable bid. It produces a bid that is loudest at the top, when premiums make issuance free, and disappears precisely when the asset needs it, replaced by supply. That is not a Strategy problem. That is the model, marked to market. And the fourth point concedes the tell: if the coupon were so obviously safe, a 12% perpetual from a company sitting on $55 billion of collateral would not be stuck at $87.
What Would Change the Math
The honest version of this story has clean falsifiers, and they are all observable on a public tape.
STRC’s price. The whole condition now hangs on one number. A grind from $87 toward the high $90s over the coming weeks would signal the 12% rate is doing its job and the purchase gate could reopen. Another rate hike at the next monthly reset — or a slide toward the low $80s despite one — would signal the discount is issuer-risk pricing that coupon increases cannot buy back.
The weekly 8-Ks. Strategy now discloses its capital activity weekly. Watch three lines: further BTC sales against the remaining ~$1 billion of authorization, whether ATM proceeds keep flowing to the USD reserve, and any STRC issuance below par — which would contradict the par doctrine within weeks of its announcement.
The July 28–29 FOMC meeting. The soft June CPI cut hike probability sharply. If the Fed validates the disinflation and Bitcoin still cannot hold a rally, the “macro was the headwind” defense loses its last support.
The Reserve. Any confirmed open-market purchase under the Strategic Bitcoin Reserve — or a Treasury/Commerce resolution with a funded mandate — would reintroduce a marginal buyer large enough to make Strategy’s absence irrelevant. Sixteen months of precedent argues against holding one’s breath.
Until one of those falsifiers fires, the situation is what Phong Le said it is. The largest Bitcoin buyer of the era is out of the market, by policy, indefinitely. Its return is pegged to a preferred stock thirteen points under par. And the instrument’s path back to par runs through a dividend the company pays, when cash runs short, by selling Bitcoin. Saylor built a machine that turned paper into coins. Its successor turns coins into coupon payments — and the man running it just told you, on the record, that he doesn’t know when that ends.
Sources and Related Coverage
- Strategy Form 8-K filings (June 29–July 5 and July 6–12, 2026 reporting periods): 3,588 BTC sold for ~$216M; 4,818,781 MSTR shares sold for ~$466.7M net; holdings of 843,775 BTC; $3.0B USD reserve
- Phong Le interview, Bloomberg, July 16, 2026 (“When Stretch gets back to par, we’ll issue more. We’ll buy more Bitcoin.”)
- Strategy STRC dividend announcement: 12.00% per annum effective for record dates on or after July 1, 2026; prior 11.5% held four consecutive months (CoinDesk, June 1, 2026)
- STRC market price $87 (July 15, 2026); MSTR $97 close July 16, down ~75% over twelve months (CoinGape, Yahoo Finance)
- June CPI: -0.4% MoM (BLS, July 15, 2026); spot Bitcoin ETF flows: -$4.5B June, +$107.8M July 15 (Farside/FX Leaders/The Market Periodical)
- Strategic Bitcoin Reserve status: Treasury/Commerce dispute, no confirmed open-market purchases (Bloomberg, CoinDesk, July 2026)
- Related: Strategy raised $467 million in a week and bought zero Bitcoin
- Related: the $1.25 billion Bitcoin sale authorization and what it reversed
- Related: the leverage math behind Strategy’s permission to sell
- Related: June’s record ETF outflow month and the corporate-buyer retreat