
May 2026 will be recorded as the month oil had its worst decline since the pandemic. Brent crude lost roughly 19% across the month, closing at $92.56 per barrel on May 29. The trigger was a geopolitical development that markets had been priced for conflict to prevent: a 60-day memorandum of understanding between the United States and Iran, reportedly “mostly agreed” but still pending final sign-off from President Trump. The expected reopening of the Strait of Hormuz — through which roughly 20% of global crude supply flows — collapsed the risk premium that energy markets had been carrying for months.
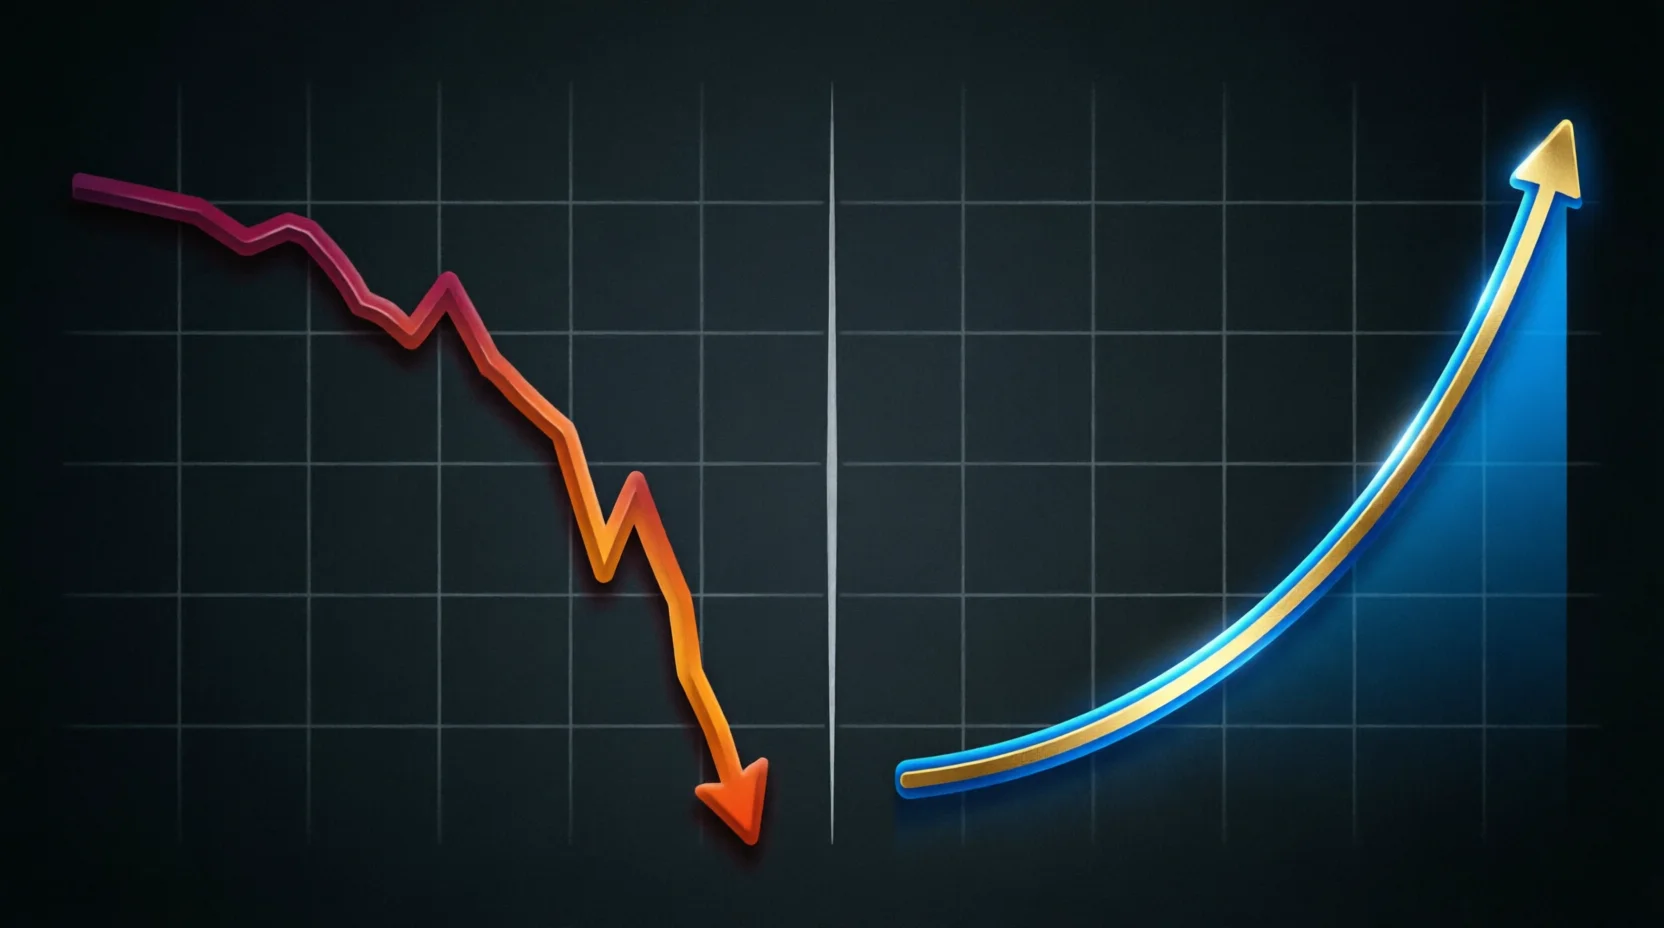
Equity markets read the same news the opposite way. The S&P 500 hit an all-time high of 7,563.63 on May 29, rising 0.6% in a single session. Earlier in the month, as Hormuz deal speculation intensified, the index had already broken 7,534. The logic was straightforward: lower oil prices relieve inflationary pressure, reduce the probability of additional Federal Reserve rate hikes, and ease operating costs for businesses that had been absorbing elevated energy input costs for the better part of two years. Wall Street took both gifts simultaneously.
The problem with that read is the word “mostly.”
What the Ceasefire Agreement Actually Says
The deal, as reported, is a 60-day MOU extension — not a permanent settlement, not a nuclear framework agreement, and not a binding treaty. US and Iranian negotiators have reached convergence on terms, but the agreement has not been executed. Presidential sign-off from Trump is required. The 60-day structure is itself telling: it reflects how difficult sustained de-escalation between Washington and Tehran has historically been, and how much uncertainty both sides are still carrying about what comes after the initial ceasefire window.
The immediate market-relevant clause is the expected reopening of the Strait of Hormuz. Iranian mining and naval posturing in the Strait, which escalated significantly in early 2026 as part of the broader conflict dynamic, has been the primary driver of the risk premium embedded in oil prices since late 2025. If vessel traffic normalises, the supply availability that markets priced out returns — which is precisely why Brent dropped as aggressively as it did in May.
UBS is among the institutions urging caution on that read. The bank noted publicly that vessel traffic through the Strait has not yet returned to pre-conflict levels, and that the gap between “deal announced” and “tankers transiting normally” is not zero. Insurance underwriters, who had repriced Strait transit risk sharply upward, are expected to revise rates downward only once actual traffic data confirms normalisation. Markets, as often happens, moved before the underlying reality.
The Oil Math Behind the Drop
A 19% monthly decline in Brent crude is not a routine correction. For context, only the COVID demand collapse of March–April 2020 produced a comparable single-month drawdown in recent history. The OPEC+ supply management framework that has operated since 2022 has generally cushioned oil from drawdowns of this magnitude, which is why the Iran-driven risk premium had been so persistent — it offset what would otherwise have been softer fundamentals in a global demand environment that, outside the US and India, has been underperforming 2025 forecasts.
Strip out the conflict risk premium and the underlying oil supply-demand picture looks more modestly bullish than Brent at $110+ implied. Global demand growth projections from the IEA for 2026 have been revised down twice this year, largely on Chinese industrial activity and European recessionary pressure. The US shale sector, which had been restrained by capital discipline norms established post-2020, has shown early signs of production acceleration in the Permian at sustained prices above $80. If Hormuz normalises, the fundamental floor for Brent is probably in the low-to-mid $80s, not the mid-$90s where it has traded.
That is a meaningful distinction for inflation expectations. US CPI energy components, which drove a significant portion of the headline inflation readings that complicated Federal Reserve policy through 2025 and into early 2026, would face meaningful sequential compression if Brent sustains near current levels through Q3. The disinflationary impulse is real. Whether it is durable depends entirely on whether the MOU holds.
The Stagflation Risk That Hasn’t Disappeared
The equity market’s all-time high response to falling oil prices involves a scenario assumption that deserves scrutiny. The bull case runs: oil falls, CPI falls, the Fed stays on hold or cuts, multiples expand, AI capex continues, S&P 500 earnings estimates hold. Each link in that chain is plausible. None of it is guaranteed.
The risk case runs: the MOU collapses, Strait tensions re-escalate, oil rebounds sharply, and the disinflationary window closes before the Fed has time to act on it. That scenario puts rate policy back in a difficult position, with the tariff-driven goods inflation already embedded in the supply chain providing a floor that monetary policy cannot easily dissolve. The stagflation risk framing that Fed watchers including Kevin Warsh have articulated — a combination of slowing growth and sticky inflation that constrains the Fed’s response function — does not disappear because oil fell in May. It goes into remission if the ceasefire holds, and it returns violently if it does not.
The complicating factor is fiscal. The One Big Beautiful Bill Act, with its projected $3.3 trillion debt addition over a decade, has already begun repricing the long end of the Treasury curve. The 10-year yield remains elevated by historical standards even with oil falling. If the ceasefire holds and energy prices stay down, the bond market’s inflation expectations component will ease somewhat — but the term premium driven by fiscal supply concerns is independent of oil prices and will not compress on the same news.
What the S&P 500 Rally Actually Reflects
The S&P 500’s all-time high needs to be read in its component structure, not just its headline level. The rally that has carried the index to 7,563 is heavily concentrated. Analysis of breadth data shows the advance has been disproportionately driven by a cohort of technology and infrastructure companies with 35–70% data center revenue growth — names that benefit from AI capex spending regardless of oil prices, and that have continued to outperform even during the periods of maximum geopolitical uncertainty.
Broader market participation has narrowed. Small-cap indices, which are more sensitive to domestic credit conditions and which do not benefit from hyperscaler AI infrastructure spend, have underperformed the headline index significantly in 2026. Cyclical sectors that should benefit from lower oil prices — airlines, chemicals, consumer discretionary — have responded, but not enough to change the composition story: this is still largely an AI-capex rally with an energy tailwind attached.
The split between AI capex spenders and the rest of the S&P 500 has been one of the defining market structure themes of 2026. Microsoft, Alphabet, Meta, and Amazon have each committed to capital expenditure programs that individually exceed entire sector capex budgets from five years ago. The oil price decline gives those programs a modest cost-of-capital benefit via its effect on inflation expectations — but it does not change the fundamental thesis that the S&P 500’s trajectory is being driven by a relatively small number of companies making very large infrastructure bets on AI adoption at scale.
What Lower Oil Prices Do to the Macro Picture
There are three direct transmission mechanisms from lower oil to the broader economy worth tracking.
First, consumer purchasing power. US households spend a meaningful portion of discretionary income on gasoline and utility bills. A sustained 15–20% reduction in energy costs acts as a tax cut for the median household — real purchasing power improves without requiring any wage growth. Consumer confidence surveys, which had been dragged lower by energy cost anxiety, should improve if pump prices follow crude lower with the usual 4–6 week lag.
Second, freight and logistics costs. Diesel prices drive a significant portion of the cost structure for trucking, rail, and maritime shipping. Lower energy costs reduce the input-cost inflation that had been cascading through supply chains since 2025, providing some relief for goods prices that the tariff regime has kept elevated at the import level. The net effect on goods CPI is ambiguous — tariffs push up, energy pushes down — but the directional improvement is real.
Third, corporate earnings. Corporate America was already under scrutiny for its AI spending commitments, with CFOs beginning to push back on infrastructure investments that had not yet produced demonstrable returns. Lower energy costs reduce the operating expense pressure on energy-intensive industries — manufacturing, chemicals, transportation, data centers — and provide a margin buffer that softens the ROI scrutiny on discretionary spending.
The 60-Day Window Problem
The structural problem with pricing a 60-day MOU as a permanent resolution is that sixty days is a short runway. The Iran-US relationship has oscillated between nuclear framework negotiations and confrontational escalation multiple times since 2015. The 2015 JCPOA was reached, abandoned in 2018, partially restored, and then structurally degraded through sequential violations. A 60-day ceasefire MOU is not a JCPOA. It is a pause, with terms that both sides have “mostly” agreed upon and that still require presidential execution.
Markets that price a pause as a resolution are taking on asymmetric risk. If the MOU executes and holds — and further, if a longer-term framework is negotiated during the 60-day window — the current market pricing is broadly correct and energy inflation is genuinely over. If the MOU fails to execute, or executes but collapses within the window, the risk premium returns. At $92/barrel, oil has already priced in significant progress. The downside from a breakdown is more material than the upside from confirmation.
UBS’s vessel traffic caveat is the cleanest operational signal to watch. When tanker transits through the Strait return to pre-conflict weekly averages — verifiable through Lloyd’s List and Marine Traffic data — the physical market will have confirmed what the financial market has already priced. Until then, the 19% May decline is a bet on an outcome that has not yet been operationally verified.
What to Watch
The near-term market-moving variables, in rough order of significance:
- Trump sign-off on the MOU — the deal does not exist in executable form until this happens. The White House’s public posture matters; any signal of hesitation or preconditions not yet met would reprice oil and equities immediately.
- Strait of Hormuz vessel traffic data — weekly tanker transit counts from Lloyd’s List or equivalent. The gap between “ceasefire agreed” and “commercial vessels transiting normally” is the risk the market is not fully pricing.
- US CPI June print — the May energy decline will begin to show in June’s headline CPI. If the print surprises lower, Fed expectations will shift and the equity rally will have a second leg. If energy prices recover before the print, the disinflationary impulse is already over.
- OPEC+ response — the cartel had been restraining supply partly to offset Hormuz risk premium. If that risk premium disappears, the incentive structure for continued supply restraint weakens, and some members may increase production to compensate for lower prices with higher volume.
- Iran domestic compliance — Iranian hardline factions opposed to any deal with the US have derailed previous negotiations. Internal Iranian political dynamics, particularly the position of the Islamic Revolutionary Guard Corps, are an underappreciated risk to MOU execution.
The Bottom Line
Oil’s worst May since COVID is a real event with real consequences for inflation, consumer purchasing power, and corporate margins. The S&P 500’s all-time high reflects a market that has absorbed the implications and decided they are net positive. That read is not unreasonable.
What it is not is a settled outcome. A 60-day MOU that has been “mostly agreed” but not executed is a probabilistic improvement, not a resolved fact. The 19% decline in Brent has priced it as something closer to resolved. The gap between those two positions is the risk that the next sixty days will either confirm or expose.
Markets are very good at repricing reversals quickly. The question is whether the reversal, if it comes, finds investors positioned for it or still celebrating May’s record close.
The 60-day window problem is not primarily a geopolitical question. It is a decision-making problem under genuine uncertainty, and the decision markets made in the final week of May was to price the probability of a durable ceasefire very close to 1. That probability is too high. The base rate for 60-day preliminary frameworks in Middle East negotiations converting into durable agreements — across four decades of diplomatic history — is not reassuring. The Minsk process, the Oslo interim accords, the Gulf ceasefires of the 2000s: each was priced at announcement as substantially closer to resolution than it proved to be. The correct mental model is expected value across the probability distribution, not narrative confidence in the best case: multiply the durability probability by the oil price that a durable deal justifies, multiply the breakdown probability by the conflict-premium price that renewed tension restores, and the result is a Brent level that sits meaningfully above the current close. The market has not done that math. It has priced the best branch and treated it as the median. The more instructive signal from May 2026 was not what oil did in isolation, but what happened simultaneously across the broader risk landscape. In the same fortnight that Brent logged its worst monthly decline since COVID, the BlackRock IBIT Bitcoin ETF recorded $2.54 billion in consecutive-session outflows — a synchronized de-risking signal that cut across asset classes and indicated the macro rotation was wider than any single commodity narrative could contain. Markets celebrate reversals loudly. They reprice them quietly, in the sessions after the headlines move on. The 19% decline is the celebration. What the next sixty days reveals will be the reprice.
What the MOU Left Unverified
A memorandum of understanding is not a treaty. It commits the parties to a framework; it does not, by itself, install the monitoring that makes a framework hold. When the ceasefire terms were released, the document set a sixty-day window and a reopening of the Strait of Hormuz. It did not name who verifies compliance, on what cadence, or what happens on the sixty-first day if one side reads the terms differently than the other. Those omissions are not a drafting oversight. They are the negotiable space both parties preserved on purpose.
Markets read the signing as the event. The more accurate reading is that the signing started a clock. Every prior Middle East framework that moved oil — the tanker-war pauses of the 1980s, the intermittent Gulf de-escalations since — survived only as long as enforcement stayed cheaper than defection for both sides. The MOU says nothing about that cost structure, which means the durability of the deal is not written into the document. It will be revealed by behaviour over the window.
The test did not stay hypothetical for long. Within weeks a renewed Hormuz scare pushed Brent back above $84 and reopened the conflict premium the ceasefire had priced out — a live read on how quickly the discount could reverse when the first ambiguity was tested. A 19% Brent decline had priced the framework as an outcome. The framework is a process, and processes with no named verifier and no defined penalty are precisely the ones that reprice when tested. What the next sixty days establishes is not whether the parties signed. It is whether either one had a reason to keep its word once the headlines moved on.