Three numbers defined Q2 2026. The S&P 500 rose approximately 15%, its best quarterly performance since 2020. The Nasdaq gained 27.5%, its strongest quarter in four years. Bitcoin fell 14.09%.
That divergence is not a rounding error in a noisy quarter. It is the clearest single-quarter evidence yet of a structural shift in how institutional capital is allocating to high-risk, high-upside assets. Bitcoin and large-cap AI stocks competed for the same slot in institutional portfolios during Q2. AI stocks won by approximately 30 percentage points.
The specific causes and the specific implications of that divergence are worth examining in detail, because the standard explanations — “Bitcoin is volatile,” “it was a bad macro quarter for crypto,” “sentiment was negative” — do not hold up when tested against the Q2 data.
The Numbers
Bitcoin entered Q2 2026 near $67,000 and closed June at approximately $59,000 — a decline of roughly 14.09% over the quarter. That followed a 22.2% decline in Q1. Bitcoin has now fallen approximately 33% in the first half of 2026, and is approximately 53% below its all-time high near $126,000 reached in late 2024.
Back-to-back quarterly losses to open a calendar year have occurred only twice before in Bitcoin’s history. In 2014, following the Mt. Gox collapse and the first major Bitcoin bubble, consecutive red quarters preceded an 18-month bear market that eventually drew Bitcoin down more than 85% from peak. In 2022, consecutive red quarters — Q1 down 19%, Q2 down 56% — represented the worst calendar-year performance in Bitcoin’s recorded trading history. The current cycle is the third instance of this pattern. Whether it follows the 2014 or 2022 precedent, or breaks the pattern entirely, will be answered by the H2 2026 data.
The S&P 500 delivered approximately 15% in the same quarter. The Nasdaq Composite gained 27.5%. The Philadelphia Semiconductor Index surged roughly 88%, driven by memory chip names — SanDisk and Micron both more than tripled in Q2 alone. S&P 500 earnings-per-share growth came in near 30% for the quarter, primarily driven by AI infrastructure investment flowing through the technology sector.
The spread between the Nasdaq and Bitcoin in Q2 2026 was approximately 41 percentage points in a single quarter. That is an unusually large divergence for two assets that spent the majority of 2020 and 2021 moving in the same direction.
Why This Quarter Breaks the Old Thesis
From 2020 through late 2024, institutional Bitcoin bulls advanced a specific argument: Bitcoin is a risk-on asset that benefits from liquidity injection, positive sentiment, and risk appetite. When stocks go up — particularly technology and growth stocks — Bitcoin goes up too, and typically by more. When macro conditions favor growth, Bitcoin outperforms. The evidence for this claim was strong through multiple cycles.
Q2 2026 was, by almost every measure, a risk-on quarter. Stocks posted their best performance in years. Earnings growth was near 30%. Semiconductor names more than tripled. Liquidity conditions loosened. Retail and institutional sentiment in equities was strongly positive.
Bitcoin declined 14%. The old thesis predicts the opposite outcome. The divergence is not explained by tightening liquidity, by regulatory shock, by a single exchange collapse, or by any of the demand shocks that have historically driven Bitcoin corrections. The macro backdrop in Q2 was genuinely favorable — for AI-adjacent assets. Bitcoin is not AI-adjacent in a way that captured any of that capital. That is the specific mechanism the data reveals.
The Bitcoin correlation breakdown 2026 has been building over multiple quarters. Q2 2026 is the quarter where it became undeniable in the headline numbers: risk-on quarter for stocks, risk-off outcome for Bitcoin.
The AI Capital Rotation Mechanism
The five largest U.S. hyperscalers — Microsoft, Alphabet, Amazon, Meta, and Apple — are on track to spend approximately $725 billion on AI infrastructure in 2026. Roughly 75% of that figure, close to $450 billion, flows directly into chips, servers, networking equipment, and data centers. This is not speculative investment. It is purchase orders for NVIDIA GPU clusters, AMD accelerators, Micron high-bandwidth memory, custom ASIC designs, and the construction contracts that house all of it.
That spending pattern has created a specific equity trade. Investors who want exposure to AI infrastructure buy NVIDIA, AMD, Micron, Broadcom, and the data center REITs and utilities that power them. SanDisk and Micron tripled in Q2 because AI training requires enormous amounts of high-bandwidth memory, and both companies are direct beneficiaries of the hyperscaler capex cycle. The Philadelphia Semiconductor Index’s 88% quarterly gain is not a sentiment trade. It is earnings expectations repricing in real time as hyperscaler purchase volumes confirm the demand.
Bitcoin is not part of that supply chain. It does not have customers, earnings, or a demand curve that connects to AI infrastructure spending. The investors who previously used Bitcoin as their primary “high-risk, high-upside digital future” allocation now have an alternative with tangible earnings growth. The marginal institutional dollar that was deciding between Bitcoin and AI infrastructure equities chose AI infrastructure equities in Q2 2026, repeatedly and at scale.
Michael Saylor described the Bitcoin selloff as a “capital rotation to AI” — his argument was that this rotation is temporary, that Bitcoin will reclaim the allocation once the AI hype cycle moderates. The problem with that argument is structural: if AI infrastructure investment generates the 30% EPS growth that Q2 data shows, the rotation thesis requires AI earnings to disappoint before capital flows back to Bitcoin. Capital does not typically rotate away from assets where the earnings are printing in line with expectations.
Three Narratives Q2 Tested
Institutional allocators advancing a Bitcoin position in 2025 and early 2026 relied on three distinct arguments. Q2 2026 provides clean data on all three.
The first argument was that Bitcoin functions as a macro diversifier — an asset that moves independently of the stock market and therefore reduces portfolio-level correlation. The Q2 data partially tests this claim, but unfavorably. A diversifier that declines 14% in the same quarter the S&P 500 gains 15% does reduce correlation — but it does so by producing losses, not by offsetting equity risk with uncorrelated gains. Diversification is valuable when the diversifying asset is not correlated with equities AND does not produce large drawdowns in quarters when equities are up. Q2 2026 produced the worst version of this outcome: negative return with no offsetting macro story.
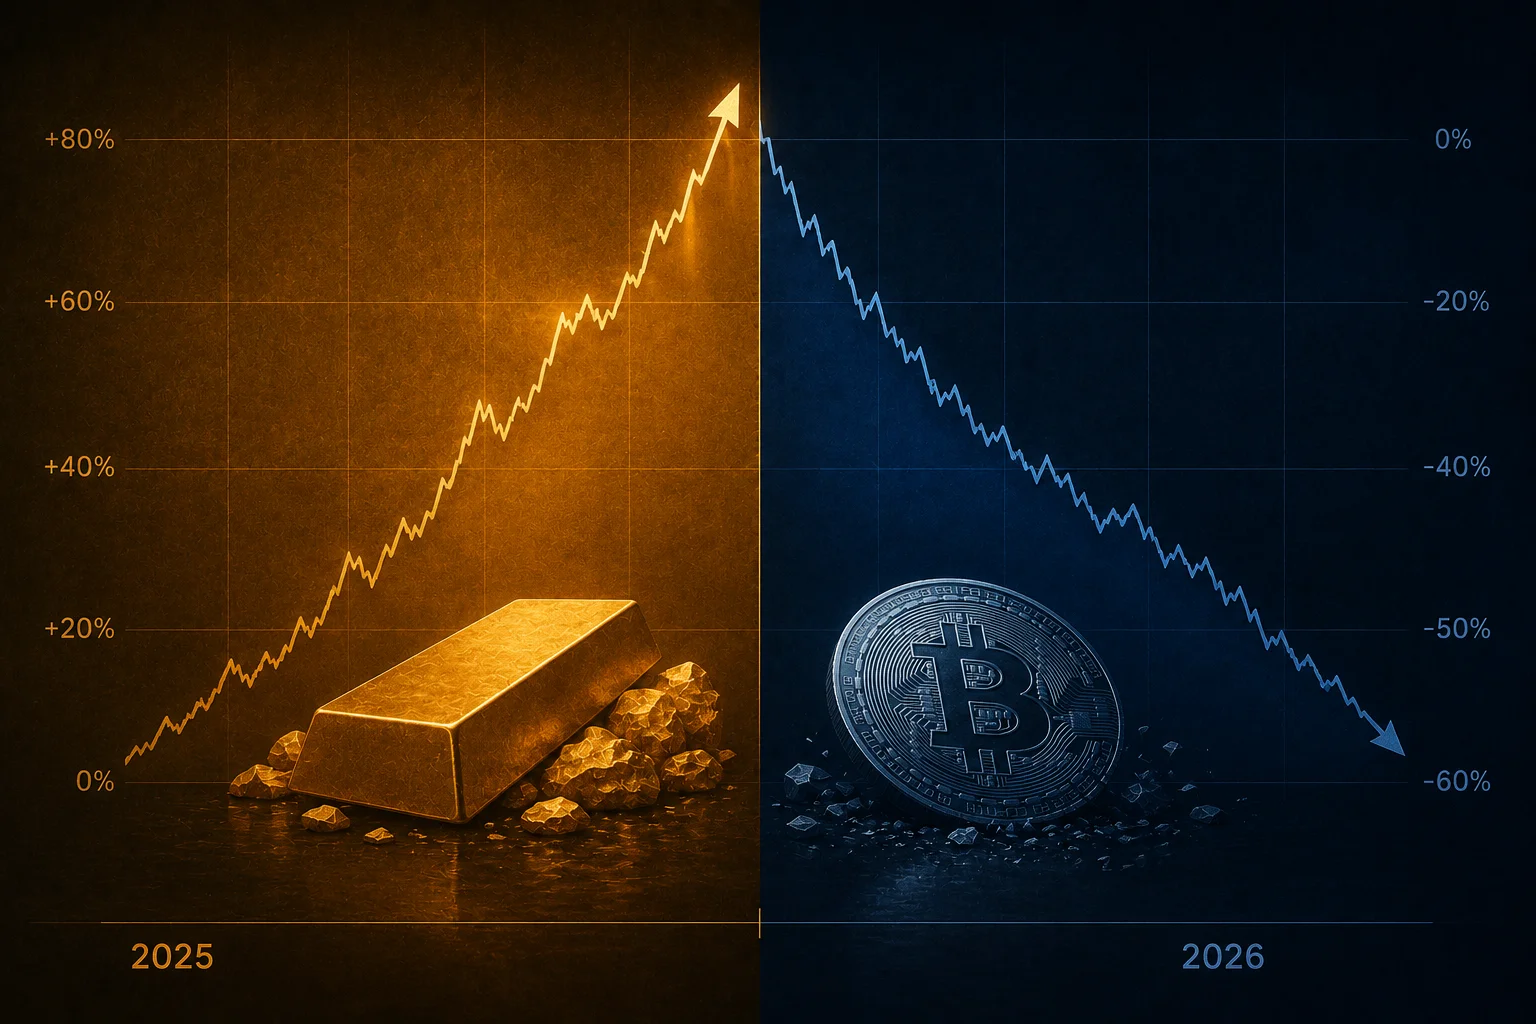
The second argument was that Bitcoin is an inflation hedge. That argument was already in trouble before Q2. The Bitcoin inflation hedge test failed 2026 as inflation ran persistently above target through Q1 and Q2 while Bitcoin declined in both quarters. Gold, by contrast, reached all-time highs in the same period. The Q2 outcome extends the pattern rather than reversing it: in the inflation environment the hedge thesis specifically requires, Bitcoin underperformed both the inflation rate and gold.
The third argument was that Bitcoin benefits from risk appetite and liquidity injection — that it is, in essence, a leveraged bet on positive macro sentiment. Q2 2026 provided the clearest available test of this claim: a quarter with strong positive macro sentiment, strong equity performance, and a collapse in Bitcoin. The “leveraged macro bet” thesis would have predicted Bitcoin outperforming the S&P 500 in Q2. It underperformed by 29 percentage points. This is not a marginal miss; it is a directional failure.
The Halving Cycle Playbook Did Not Apply
Bitcoin’s historical price behavior has followed a consistent pattern: a halving event — where the block reward paid to miners is cut in half — has preceded a major bull run by twelve to eighteen months in each of the three previous cycles. The 2016 halving preceded the 2017 run to $20,000. The 2020 halving preceded the 2021 run to $69,000. The 2024 halving, which occurred in April 2024, preceded an initial run to $126,000 by November 2024. Through that lens, the cycle appeared on schedule.
What the 2024 halving cycle did not anticipate is that it occurred after AI infrastructure investment became a competing destination for the marginal “digital future” dollar. Prior halving cycles played out in an environment where Bitcoin was the primary liquid asset for investors seeking asymmetric upside in a technology-driven future. The 2024 cycle played out in an environment where NVIDIA and Micron were delivering 88% quarterly gains backed by real earnings growth. The halving supply shock that historically tightened Bitcoin’s supply against growing demand encountered a Q2 2026 where demand was growing — but growing for AI equities, not Bitcoin.
The 200-Week Moving Average
Bitcoin’s price crossed below its 200-week moving average in late Q2 2026 for the first time since the 2022 bear market — triggered, according to technical analysts, by a blowout May payrolls report that repriced Federal Reserve rate-cut expectations. The 200-week MA currently sits near $59,000 to $61,000 and is rising as older low-price observations roll out of the calculation window.
The 200-week moving average is significant in Bitcoin’s technical history specifically because it has marked the approximate bottom of every major Bitcoin bear cycle from 2015 onward. In 2015, Bitcoin traded near its 200-week MA before recovering more than 5,000% through 2017. In 2019, it served as support during the accumulation phase before the 2020 bull run. In late 2022, Bitcoin’s low near $16,000 coincided with the 200-week MA reaching that level after the FTX collapse.
The historical pattern is not a guarantee. It reflects an empirical observation that long-term holders and accumulation-oriented buyers have historically entered near this level. Whether Q3 2026 provides confirmation — with Bitcoin closing weekly candles above the 200-week MA after testing it — or a breakdown below it for a sustained period, will determine whether the current cycle follows the 2022 recovery precedent or the 2014 extended bear scenario.
Trimming, Not Capitulating
The ETF flow data through Q2 provides a more nuanced picture than the headline Bitcoin price implies. U.S. spot Bitcoin ETFs logged approximately $4.06 billion in net outflows in June alone — the highest monthly redemption total since the products launched in January 2024. The total combined crypto ETF asset base fell from approximately $104 billion to $94 billion during the quarter.
However, the outflow pattern within that data is concentrated rather than distributed. The largest funds — BlackRock’s IBIT, Fidelity’s FBTC — saw the heaviest absolute outflows simply because they hold the largest positions. On the day that Bitcoin showed the earliest signs of stabilization in mid-June, BlackRock’s IBIT led an $86 million net inflow day — suggesting that some institutional buyers view current price levels as opportunistic rather than distressed.
The record Bitcoin ETF outflows in June 2026 represent trimming — portfolio rebalancing toward AI equities from institutional positions that are still in net positive territory from 2024 cost basis levels. This is a different dynamic from the 2022 capitulation, which featured forced selling from levered positions (Three Arrows Capital, Celsius, BlockFi) and produced a supply overhang at every level of the order book. Q2 2026 institutional outflows are orderly, relatively slow, and concentrated among the largest position holders.
The distinction matters for the Q3 outlook. Capitulation-driven selling creates specific recovery conditions: the forced sellers exhaust their supply, the price stabilizes, recovery begins from a low-sentiment bottom. Trimming-driven selling has no natural exhaustion point — it continues as long as the alternative (AI equities) continues to outperform. If the S&P 500 and Nasdaq continue delivering 15% and 27% quarterly returns respectively, there is no mechanical reason for institutional trimming to stop.
The Counterargument — Taken Seriously
The strongest version of the bull case for Bitcoin at current levels is not that AI rotation is temporary. It is something more specific: Bitcoin’s supply is genuinely finite in a way that AI equities are not. Every company in the Philadelphia Semiconductor Index can issue new shares, acquire competitors, split and recombine in any configuration the market demands. The addressable market for chips, servers, and data center power can expand indefinitely as AI deployment scales. Bitcoin’s supply schedule is fixed by protocol and cannot be changed regardless of demand.
At $59,000 per Bitcoin, the scarcity premium is priced at a level substantially lower than its 2024 peak. Buyers who believe in the long-term scarcity thesis — that a fixed-supply asset that cannot be diluted will accumulate value relative to infinitely issuable fiat currency over decades — find a more compelling entry point at $59,000 than at $126,000. The on-chain data shows long-term holder accumulation continuing at current price levels, even as ETF outflows create short-term downward pressure.
The 2022 precedent is also not unfavorable. After Bitcoin’s worst quarterly performance in history (Q2 2022, -56%), the asset recovered more than 100% within the following twelve months. The recovery was not because the structural headwinds (FTX collapse, Three Arrows, rising rates) resolved cleanly. It was because the Bitcoin price at cycle lows reflects maximum pessimism, and maximum pessimism is historically mean-reverting. The 200-week MA at $59,000 to $61,000 rising toward price is, in this reading, the most reliable technical setup in Bitcoin’s cycle history.
The counterargument’s weakest point is its assumption about where the AI capex cycle goes from here. The bull case for Bitcoin at $59,000 is most credible in a scenario where AI infrastructure earnings disappoint — where the $725 billion in hyperscaler capex proves excessive relative to the AI revenue it generates, and capital rotates back from semiconductor stocks to alternative stores of value. That scenario exists. Its probability over the next two quarters is the primary variable the Bitcoin bull and bear cases disagree on.
What Q3 Will Answer
Two data streams will determine whether Q2 2026 was the inflection point or the first chapter in a longer divergence.
The first is ETF flow direction in July. If IBIT and FBTC show sustained net inflows over multiple weeks in early July — not a single-day recovery, but consistent positive flow — it signals that institutional trimming has run its course at current price levels and buyers are returning at the 200-week MA. If outflows continue at Q2 volumes, it signals the trimming is structural and connected to a reallocation thesis that will persist regardless of short-term price movements.
The second is AI earnings quality in Q2 reporting. The S&P 500’s Q2 earnings season begins in mid-July. If hyperscaler earnings — Microsoft, Alphabet, Amazon, Meta — confirm the 30% EPS growth trajectory and maintain or raise AI capex guidance, the capital rotation thesis strengthens. If earnings miss on AI revenue while capex remains high, the rotation thesis weakens and Bitcoin’s relative value proposition improves.
Q2 2026 was the quarter when the three dominant institutional arguments for Bitcoin — diversifier, inflation hedge, risk-on beneficiary — produced negative outcomes simultaneously in a favorable macro environment. That is a specific and falsifiable claim about what drove the divergence from the S&P 500. Q3 2026 will either reinforce it with additional data or provide the contradiction that complicates the thesis.
- KuCoin — Bitcoin Enters Q3 Pressure Zone After Two Consecutive Quarterly Losses in 2026
- Crypto Daily — Bitcoin’s Stock-Rally Humiliation: Why BTC Missed the Biggest Equity Quarter Since 2020
- Crypto Times — Bitcoin on 200-Week MA Signals Deeper Bear Phase as AI Capital Rotation Continues (July 1, 2026)
- Investing.com — Bitcoin Can’t Find a Floor While AI Quietly Soaks Up the Risk Capital
- The Defiant — Bitcoin Breaks 200-Week Moving Average for First Time Since 2022 as Jobs Report Reprices Fed Cuts
- DailyCoin — Spot Bitcoin ETFs Record $4.06B Monthly Outflows, Institutional Investors Reduce BTC Exposure
- FinanceFeeds — Bitcoin Nears Rare Third Straight Quarterly Loss: History Suggests 2027 Recovery Could Follow
- Decrypt — Strategy’s Michael Saylor Blames “Capital Rotation” Into AI as Bitcoin Dives 13%