MSTR$124.44▲ 3.57%XAG$67.86▲ 6.22%NATGAS$2.94▲ 6.14%LEO$9.59▲ 1.09%HYPE$61.64▲ 9.92%GOOGL$362.31▲ 1.27%WTI$102.13▲ 1.80%FIGR_HELOC$1.03▼ 0.27%BNB$607.71▲ 1.71%ETH$1,672.43▲ 2.23%SOL$67.96▲ 4.25%USDS$0.9999▲ 0.02%TRX$0.3140▼ 0.24%AMZN$237.11▼ 1.82%NVDA$204.91▲ 0.02%XRP$1.14▲ 2.50%TSLA$401.51▲ 0.59%NFLX$80.91▼ 0.44%ADA$0.1736▲ 5.39%XMR$364.22▲ 1.91%XAU$4,240.10▲ 3.66%BRENT$107.14▼ 8.65%META$569.62▲ 0.21%COIN$159.77▼ 0.41%ZEC$419.68▲ 1.21%BTC$63,888.00▲ 2.38%AAPL$291.29▼ 1.47%DOGE$0.0887▲ 4.87%MSFT$387.89▼ 0.63%RAIN$0.0131▲ 0.17%MSTR$124.44▲ 3.57%XAG$67.86▲ 6.22%NATGAS$2.94▲ 6.14%LEO$9.59▲ 1.09%HYPE$61.64▲ 9.92%GOOGL$362.31▲ 1.27%WTI$102.13▲ 1.80%FIGR_HELOC$1.03▼ 0.27%BNB$607.71▲ 1.71%ETH$1,672.43▲ 2.23%SOL$67.96▲ 4.25%USDS$0.9999▲ 0.02%TRX$0.3140▼ 0.24%AMZN$237.11▼ 1.82%NVDA$204.91▲ 0.02%XRP$1.14▲ 2.50%TSLA$401.51▲ 0.59%NFLX$80.91▼ 0.44%ADA$0.1736▲ 5.39%XMR$364.22▲ 1.91%XAU$4,240.10▲ 3.66%BRENT$107.14▼ 8.65%META$569.62▲ 0.21%COIN$159.77▼ 0.41%ZEC$419.68▲ 1.21%BTC$63,888.00▲ 2.38%AAPL$291.29▼ 1.47%DOGE$0.0887▲ 4.87%MSFT$387.89▼ 0.63%RAIN$0.0131▲ 0.17%
Prices as of 17:15 UTC

Author: Brian G

  • Vertiv, Eaton, and Schneider Are the Picks-and-Shovels of the AI Buildout That Most Investors Are Still Underweighting.

    Vertiv, Eaton, and Schneider Are the Picks-and-Shovels of the AI Buildout That Most Investors Are Still Underweighting.

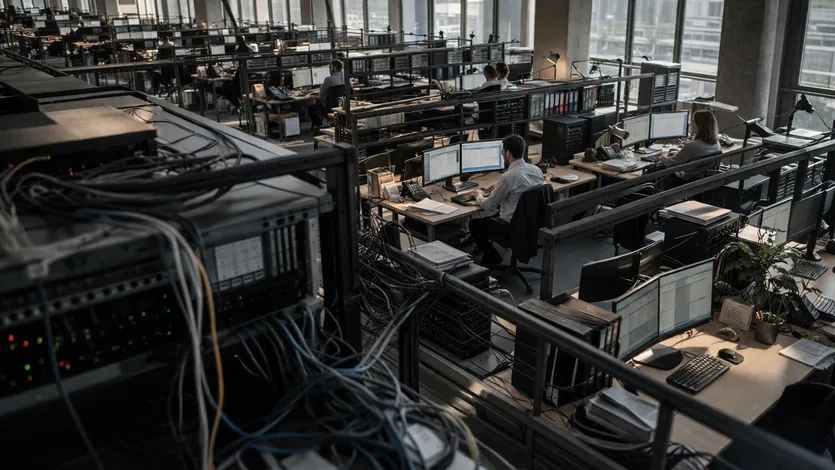
    The AI infrastructure investment discussion has been dominated by the most visible components of the value chain — Nvidia and the broader semiconductor ecosystem, the hyperscaler cloud providers building the data centers, and the utilities and REITs that have benefited from the power demand and the colocation revenue. Beneath these headline beneficiaries is a category of equipment manufacturers that provide the cooling systems, power distribution infrastructure, uninterruptible power supplies, and the broader electrical equipment that allows data centers to actually operate at the scales that AI workloads require. The companies in this category — Vertiv Holdings, Eaton Corporation, Schneider Electric, ABB, and a handful of more specialised manufacturers — have produced strong returns over the past several years but remain underrepresented in most AI infrastructure investment frameworks.

    The structural case for sustained exposure to this picks-and-shovels segment is supported by the specific demand dynamics that AI infrastructure creates. The cooling systems for AI chips that operate at multiples of traditional server power densities require purpose-built liquid cooling and air cooling infrastructure that the equipment manufacturers are positioned to provide. The power distribution infrastructure within data centers requires more sophisticated electrical equipment as the rack power densities increase. The transition from traditional air-cooled servers to the liquid-cooled AI chip configurations represents an architectural shift that benefits the manufacturers who have invested in the relevant capabilities.

    Understanding which specific companies have the strongest competitive positions, what the actual demand drivers look like at the operating level, and where the structural questions about the cycle’s sustainability sit provides important context for evaluating this often-overlooked segment of the broader AI infrastructure investment thesis.

    The Cooling Architecture Shift

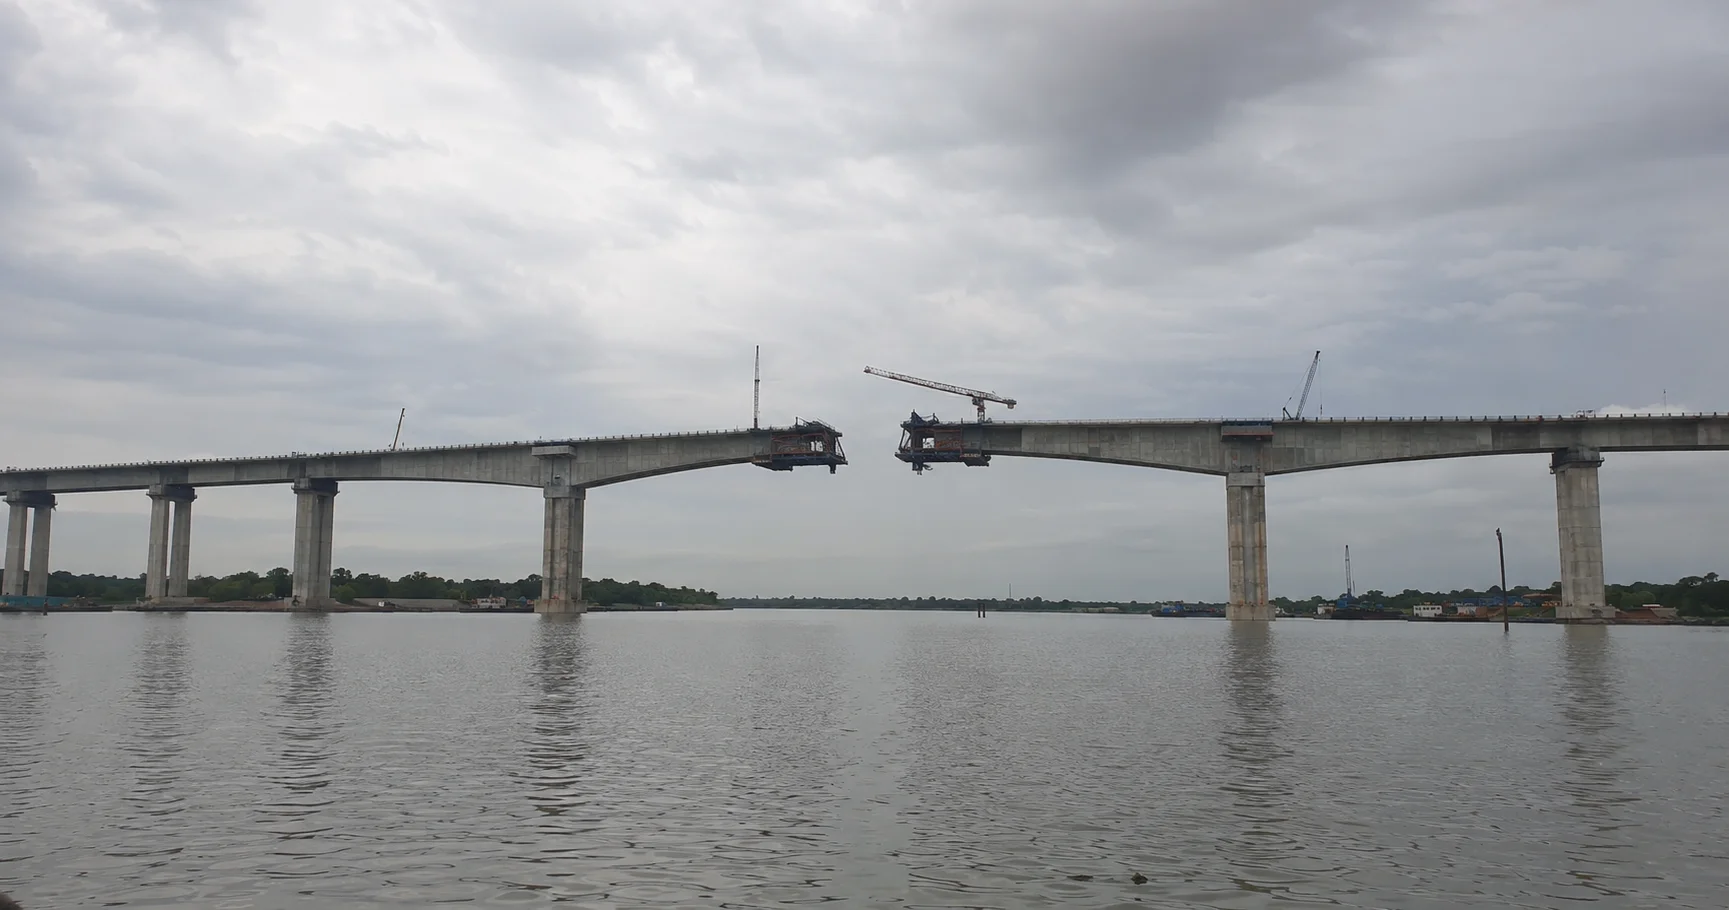
    The transition from traditional air-cooled data center architecture to liquid-cooled configurations has been one of the most consequential infrastructure shifts in the AI buildout. The earlier generation of data center cooling relied primarily on air conditioning systems that managed the thermal output of relatively low-density server configurations. The current generation of AI chips — Nvidia H100, H200, B100, and the broader high-end AI accelerator family — produces thermal output per chip that exceeds what air cooling can manage at the rack densities that AI workloads require.

    The result is that liquid cooling has shifted from a specialised application used in supercomputing and specific high-performance computing environments to a mainstream requirement for AI data center deployment. The specific liquid cooling architectures vary across deployments (direct-to-chip liquid cooling, rear-door heat exchangers, immersion cooling for the most demanding configurations) and each architecture has specific equipment requirements and operational characteristics.

    Vertiv Holdings has been one of the strongest competitive positioning beneficiaries of the liquid cooling shift. The company has invested aggressively in liquid cooling product development and has produced an integrated cooling product portfolio that addresses the various deployment requirements that AI data centers face. The financial results have reflected this competitive positioning, with Vertiv revenue growth substantially exceeding broader equipment manufacturer rates and with strong operating leverage as the AI-related demand has scaled.

    The competitive picture in data center cooling includes several other significant players. Schneider Electric has its own cooling product portfolio that has been positioned for the AI deployment requirements. Stulz, a German specialised cooling manufacturer, has captured share particularly in the European market. Various specialised liquid cooling companies (CoolIT Systems, Submer for immersion cooling, Iceotope, several others) have captured share in specific niche applications.

    The Power Distribution Equipment Demand

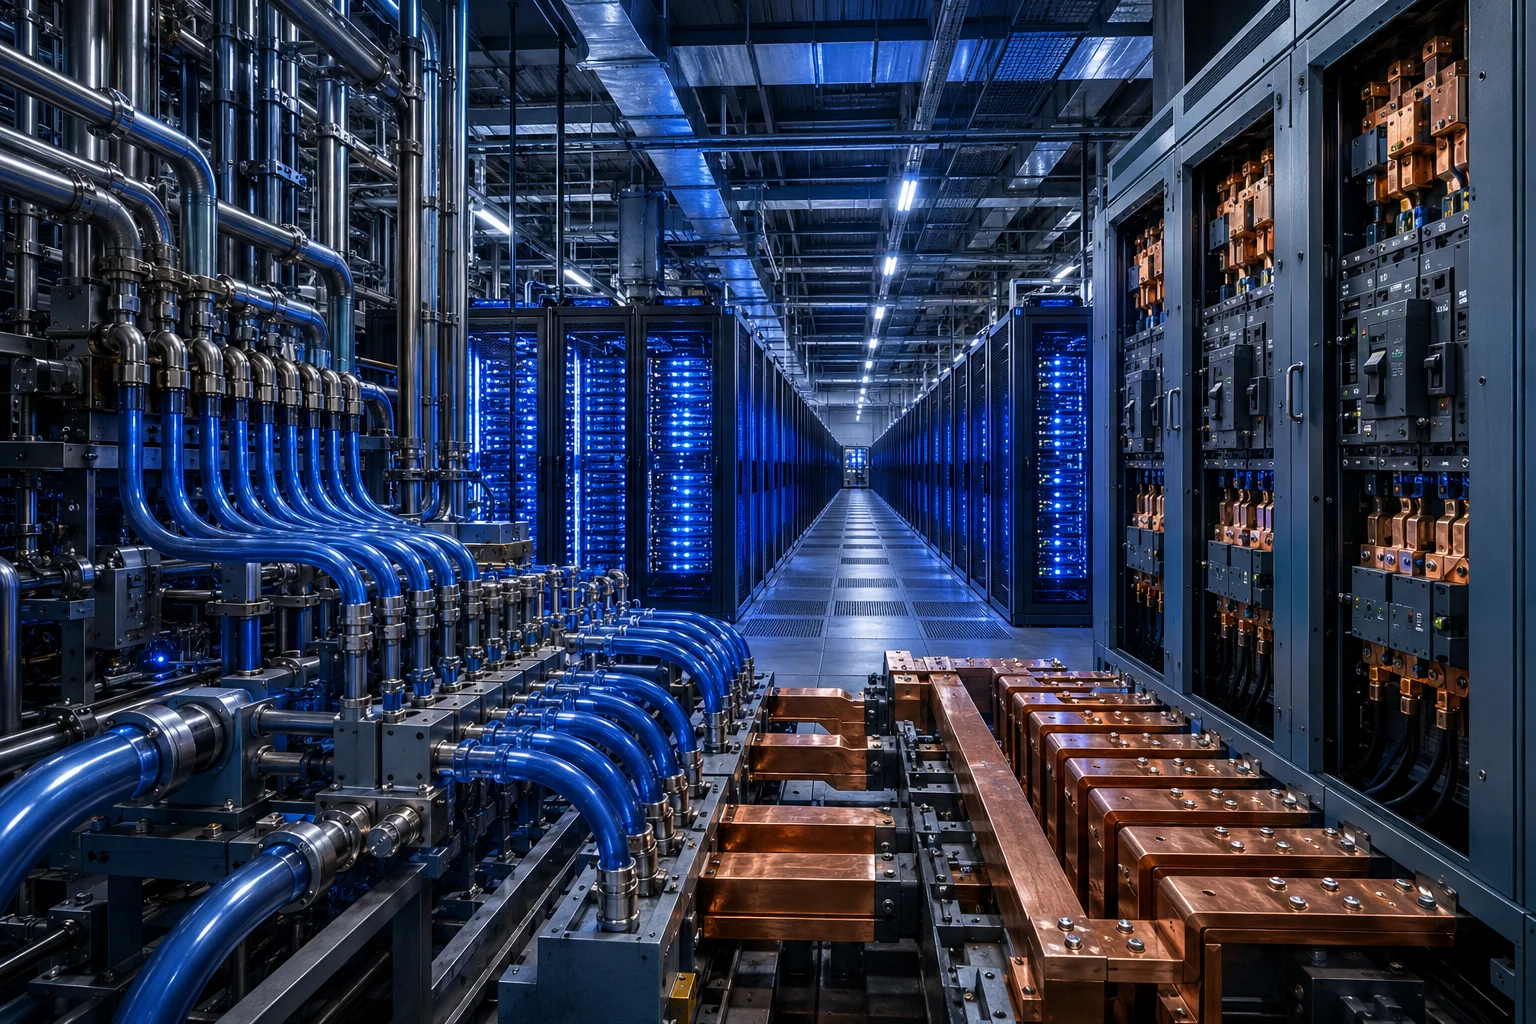
    The power distribution infrastructure within data centers has been substantially affected by the AI buildout in ways that benefit the specialised electrical equipment manufacturers. The higher power densities at the rack level (50-100 kilowatts per rack vs the 5-15 kilowatts per rack of traditional configurations) require more sophisticated power distribution units, more robust electrical infrastructure within the rack, and the broader electrical safety and management equipment that operates at these higher power levels.

    Eaton Corporation has been particularly well positioned for this segment of the AI equipment opportunity. The company’s power distribution products, uninterruptible power supplies, and the broader electrical infrastructure portfolio have benefited from the AI data center demand. The Eaton revenue growth has been strong across multiple quarters as the order book has continued to expand with AI-related procurement.

    The competitive landscape in power distribution includes Schneider Electric (which competes with Eaton across multiple electrical equipment categories), ABB (which has specific strengths in industrial-scale electrical equipment), Siemens (which has substantial electrical infrastructure capabilities through Siemens Energy and other divisions), and various more specialised players. The competitive dynamics across these manufacturers reflect both the specific product positioning each has chosen and the broader customer relationships that influence procurement decisions.

    The broader AI power infrastructure thesis includes the electrical equipment beneficiaries as one component of the picks-and-shovels exposure that captures the AI buildout demand without the direct capital intensity that affects the hyperscalers themselves. The structural growth opportunity for the equipment manufacturers extends across the multi-year capacity expansion cycle that the AI demand has created.

    The UPS and Backup Power Category

    Uninterruptible power supply (UPS) systems for data centers have been one of the most affected equipment categories by the AI buildout. The combination of higher power densities, more critical workload reliability requirements, and the substantial capital investment in AI computing infrastructure has produced demand for backup power systems at scale.

    The major UPS manufacturers include Vertiv (which has substantial UPS product positioning), Eaton, Schneider Electric, and various more specialised manufacturers. The competitive dynamics have generally favored the manufacturers with the most comprehensive integrated product offerings that allow customers to procure UPS systems alongside the broader cooling and power distribution equipment, reducing the operational complexity of multiple vendor relationships.

    The honest assessment of the UPS category is that the AI demand has been substantial but the competitive structure has been reasonably stable across the major manufacturers. The structural growth supports continued strong revenue across the major players without producing the dramatic share shifts that some other infrastructure equipment categories have experienced.

    The Switchgear and Substation Equipment Layer

    The transmission and distribution equipment layer — the electrical switchgear, transformers, and substation equipment that connects data centers to the broader electrical grid — has been one of the most acute supply constraint categories in the broader AI infrastructure buildout. The lead times for major switchgear and transformer orders have extended to multi-year horizons across the major manufacturers, reflecting both the AI-driven demand and the broader infrastructure capex cycle that affects multiple sectors.

    The major switchgear and substation equipment manufacturers include Eaton, Schneider Electric, ABB, Siemens, Hitachi Energy, GE Vernova, and various specialised manufacturers. The lead time extensions and the corresponding pricing power that the manufacturers have captured have been particularly significant for this category, with multi-year order backlogs supporting continued revenue visibility.

    The competitive picture has been affected by both the AI demand and the broader grid modernisation that the utility sector capex cycle has driven. The same equipment manufacturers that benefit from data center demand also benefit from the broader transmission and distribution modernisation, which produces revenue resilience even if specific data center demand moderates.

    The Vertiv Competitive Position Specifically

    Vertiv Holdings deserves specific attention because the company has captured one of the strongest competitive positions in the AI data center equipment buildout. Vertiv’s product portfolio spans the breadth of the equipment requirements that AI data centers need (cooling systems, power distribution, UPS, monitoring and management) and the integrated product positioning provides customer relationship advantages that pure-play competitors find harder to match.

    The financial results that Vertiv has reported through 2025 and 2026 have validated the competitive positioning. Revenue growth has been substantial, the operating margins have expanded as the AI-related premium pricing has been captured, and the order book metrics have continued to support continued strong revenue growth. The stock performance has been correspondingly strong, producing total returns that have substantially outpaced broader electrical equipment sector indices.

    The strategic question for Vertiv specifically is whether the competitive position can be sustained as the AI buildout continues and as competitors (particularly Schneider Electric and Eaton with substantial competing portfolios) compete more aggressively for the available demand. The probable trajectory is continued strong revenue with some margin pressure as competition intensifies, which would still support continued investment thesis even as the most dramatic growth periods normalise.

    The Risk Factors and Cyclical Considerations

    The picks-and-shovels equipment manufacturers face specific risk factors that warrant consideration despite the strong recent performance. The dependence on continued AI capex from the hyperscalers means that any moderation in the hyperscaler capex cycle would directly affect equipment demand. The Q2 2026 earnings season specifically will provide important evidence about whether the hyperscaler capex commitments are sustaining at the levels that current equipment manufacturer expectations imply.

    The lead time extensions that have supported pricing power could reverse if capacity comes online faster than demand grows, producing margin pressure as the equipment manufacturers compete for available orders. The historical pattern in industrial equipment cycles has been that the periods of extended lead times and pricing power are followed by periods of capacity surplus and margin compression, which means the current strong margin environment may not persist indefinitely.

    The valuation concerns are real for several of the equipment manufacturers. Vertiv specifically trades at valuation multiples that reflect strong continued growth expectations, which means the marginal return depends on continued execution against the bullish expectations rather than on multiple expansion. The other equipment manufacturers trade at more moderate multiples but still reflect the AI-driven growth in their valuations.

    The Investor Positioning Considerations

    For investors evaluating exposure to the AI infrastructure equipment thesis: the picks-and-shovels segment provides differentiated exposure to the AI buildout that complements rather than replaces the more direct AI exposures (semiconductors, hyperscalers, model providers). The specific company selection requires evaluating the competitive positioning across cooling, power distribution, UPS, and switchgear categories, with each having different specific dynamics.

    The strongest competitive positions in 2026 are at Vertiv (specifically positioned for AI data center deployment), Eaton (broader electrical equipment positioning that includes substantial AI exposure), and Schneider Electric (comprehensive product portfolio with strong global positioning). The more specialised companies (CoolIT, Submer, the various specific niche players) offer concentrated exposure to specific segments but with less diversification.

    The valuation considerations matter more in 2026 than they did at the cycle’s start. The strong performance has compressed the value opportunity that supported earlier returns, which means the marginal new position should be sized appropriately for the risk that the strong growth expectations may not be fully delivered.

    The broader portfolio considerations include the diversification benefit that the picks-and-shovels segment provides relative to direct AI exposures. The equipment manufacturers benefit from the AI buildout but also benefit from the broader electrical infrastructure modernisation that supports their businesses even if specific AI dynamics moderate. The combination provides more resilient exposure than pure AI plays with similar growth characteristics.

    The honest position is that the AI data center equipment manufacturers have produced substantial returns supported by genuine structural demand, that the competitive positioning of the leading companies is real and defensible, and that the appropriate exposure depends on careful evaluation of both the specific company positioning and the broader cyclical dynamics that affect the equipment categories. The next several years will continue to test whether the strong recent performance can be sustained, and the investors who have positioned thoughtfully across the equipment manufacturers should continue to capture attractive returns even as the most dramatic growth periods normalise.

  • India Has Been the Best-Performing Major Emerging Market for Three Years. Here Is What Is Actually Sustaining It and What Could Break the Trade.

    India Has Been the Best-Performing Major Emerging Market for Three Years. Here Is What Is Actually Sustaining It and What Could Break the Trade.

    India macro emerging market outperformance Nifty 2026

    India has been the best-performing major emerging market for three consecutive years on the metric that matters most for international investors: sustained equity returns in US dollar terms. The Nifty 50 and the broader Indian equity indices have delivered returns that have substantially outpaced China, Brazil, South Korea, Taiwan, and the broader EM index, and the outperformance has been supported by both local currency equity returns and by rupee stability that has not produced the currency-driven dollar return drag that has affected other emerging markets.

    The duration of this outperformance and the magnitude of the cumulative dollar returns has produced a valuation differential where Indian equities trade at meaningfully higher multiples than other emerging markets and at multiples comparable to or above developed market equities. The question for international allocators in 2026 is whether the structural forces that have produced the outperformance are durable enough to justify the valuation premium, or whether the trade has run far enough that the marginal risk-reward favours rotation toward less-loved emerging markets.

    The honest analytical framework requires separating the durable structural drivers from the cyclical factors, identifying the specific risks that could change the trajectory, and assessing whether the current valuations price in too much of the favourable scenario or whether the structural strength supports continued premium multiples.

    The Durable Structural Drivers

    The strongest case for sustained Indian outperformance rests on several structural factors that operate over decade-plus time horizons rather than cyclical quarters. The demographic dividend is the most visible: India’s median age is in the late twenties, the working-age population is still growing, and the dependency ratio is favourable in ways that the rest of Asia (particularly China) cannot match. This demographic structure supports sustained consumption growth, labour-force expansion, and the productivity gains that come from urbanisation and formalisation of economic activity.

    The reform agenda that the Modi government has executed across multiple terms has produced real institutional improvements. The Goods and Services Tax (GST) implementation eliminated the cascade of state-level taxes that had constrained inter-state commerce, the Insolvency and Bankruptcy Code (IBC) provided a functional framework for distressed corporate resolution, the bank recapitalisation programs cleaned up the state-owned bank balance sheets that had been a drag on the broader economy, and the digital identity (Aadhaar) and payments (UPI) infrastructure has produced one of the world’s most sophisticated financial inclusion frameworks. These reforms compound over time as the institutional improvements translate into more efficient business activity.

    The capital expenditure cycle has supported equity returns through both the direct beneficiaries (infrastructure, construction, capital goods) and through the broader productivity gains that capex-driven capacity expansion enables. Government capital expenditure has been sustained at levels that have supported infrastructure development across roads, railways, ports, and power. Private capital expenditure has finally accelerated after years of stagnation, with corporate profitability levels and capacity utilisation supporting investment decisions that capex-driven manufacturers have been responding to.

    The manufacturing diversification away from China that has been a strategic priority for both Western multinationals and Indian policy has produced specific outcomes: Apple’s significant iPhone manufacturing scale-up in India through Foxconn and other partners, the broader electronics manufacturing growth, and the textile, automotive, and pharmaceutical capacity expansion that has captured share from Chinese alternatives. The Chinese economic transition’s challenges have created opportunities for India that the supply-chain diversification narrative supports.

    The Rupee Stability That Underlies the Dollar Returns

    The currency dimension of Indian outperformance is genuinely impressive and underappreciated in many analyses of Indian equity returns. The rupee has been notably stable against the dollar over the past several years compared to other emerging market currencies, with the Reserve Bank of India (RBI) executing a managed exchange rate policy that has prevented the currency volatility that has plagued other EM currencies during episodes of dollar strength.

    The RBI’s foreign exchange reserves — over $700 billion as of mid-2026 — provide substantial firepower for managing rupee stability against external pressures. The current account position has remained manageable, supported by service exports (IT services particularly) and remittances that offset the goods trade deficit. The capital flows have been supportive: foreign portfolio investment, foreign direct investment, and global capital deploying into Indian opportunities have all contributed to sustained capital inflows that support the rupee.

    The policy framework has prioritised currency stability over other objectives that EM central banks sometimes prioritise. The RBI has accepted higher real interest rates than would be optimal for growth-only considerations in order to maintain the currency stability that supports the broader macro framework. This policy choice has costs (tighter financial conditions, modestly slower growth than would otherwise occur) but has produced the rupee stability that has been essential for the dollar-return story.

    The broader dollar environment has been favourable for emerging market currencies generally, but India has benefited disproportionately because the rupee stability removes the currency risk that has been the primary obstacle for international investors considering EM equity exposure. A USD investor in Indian equities receives the underlying equity returns without the currency volatility that has historically plagued EM equity exposure.

    The Valuation Premium and What It Implies

    Indian equities currently trade at forward price-to-earnings multiples of roughly 20-22x for the broader market and significantly higher for specific sectors. This is a meaningful premium to other major emerging markets (Brazil at 8-10x, Korea at 10-12x, China at 10-13x, Taiwan at 14-16x) and to the broader EM index average. The premium is comparable to or above the US S&P 500 forward multiple, which is itself elevated by historical standards.

    The bull interpretation of the valuation premium is that Indian equities deserve a structural re-rating because the durable growth potential, the institutional improvements, and the demographic dividend justify multiples that previous EM valuations did not. The argument is that India is not being properly compared to other EMs but should be evaluated on a developed-market valuation framework given the structural quality of the growth trajectory.

    The bear interpretation is that the premium prices in too much of the favourable scenario, that the marginal investor decision at current valuations requires expecting Indian fundamentals to continue exceeding expectations rather than just meeting them, and that the historical pattern of EM valuation premiums has been that they eventually compress when execution disappoints or when external conditions become less favourable.

    The honest analytical position is somewhere between these interpretations. The structural case for sustained Indian outperformance over a 5-10 year horizon is genuinely strong, but the current valuations require the structural case to continue playing out without significant disruption. The risk-reward at current entry valuations is asymmetric — limited upside if everything continues to go well, substantial downside if any of the favourable forces reverse.

    The Political Risk That Markets Tend to Underprice

    The political dimension of Indian macro deserves more attention than it typically receives in equity analysis. The Modi government’s 2024 election produced a result that fell short of the BJP’s parliamentary majority expectations, requiring coalition support from the NDA partners to maintain the governing arrangement. The coalition dynamics have constrained policy execution in ways that the BJP’s previous parliamentary majorities did not, and the specific reforms that face coalition resistance have moved more slowly than they would have under a clear majority government.

    The structural political risk is what happens after Modi. The Prime Minister’s personal political brand has been a critical component of the BJP’s electoral success, and the succession question for both the BJP and the broader Indian political landscape is one of the most significant medium-term variables that equity analyses tend to set aside. The continuity of the reform agenda, the foreign policy posture, and the macro framework all depend partly on the political continuity that Modi has personified.

    The opposition political dynamics — the Congress Party’s modest revival, the regional parties’ continued importance, the various caste and religious tensions that have been managed but not resolved — represent the other dimension of political risk. Indian politics is sufficiently fractured that any specific election produces meaningful uncertainty, and the equity market’s tendency to focus on the immediate-term policy continuation rather than the structural political fluidity has produced complacency that may not be warranted.

    The Specific Sector Dispersion

    The aggregate Indian equity performance has been driven by specific sector dynamics that warrant individual attention. Financial services — particularly the private banks (HDFC Bank, ICICI Bank) and non-bank financials — have benefited from the credit cycle, the digital banking transformation, and the broader formalisation of the economy. The IT services giants (TCS, Infosys, HCL, Wipro) have benefited from continued global IT services demand and from the AI-related transformation that has supported services revenue.

    The capital goods and infrastructure sector has performed well as the capex cycle has accelerated. Manufacturers across automotive, pharmaceuticals, and consumer products have captured shares of the domestic growth and increasingly of export markets. The energy and materials sectors have benefited from the broader commodity environment and from India’s specific energy security and renewable transition policies.

    The consumer-facing sectors have had more mixed performance. Rural consumption has lagged urban consumption, the high-end consumer sectors have outperformed the mass-market segments, and the K-shaped recovery dynamics that affected India during the pandemic have not fully reversed. Investors evaluating Indian consumer exposure need to distinguish between the premium consumer sectors (where pricing power and growth are strong) and the mass-market sectors (where demand has been more cyclical).

    The Catalysts That Could Change the Trade

    The specific catalysts that could meaningfully disrupt the Indian outperformance include external shocks (global recession, dollar strength that overwhelms RBI policy capacity, specific commodity price shocks that disproportionately affect Indian inflation and growth), political events (election results that challenge policy continuity, coalition disruptions, geopolitical tensions that affect the supply-chain diversification narrative), and execution disappointments (capex cycle that fails to sustain, banking sector credit quality deterioration, specific sector-level shocks).

    The valuation-related catalysts that bear monitoring include any significant repricing of the broader EM complex (which could pull Indian multiples lower despite Indian fundamentals continuing to perform), changes in foreign portfolio flow patterns (which have been net positive but could shift), and changes in domestic flow patterns (Indian mutual fund inflows have been a substantial support for valuations that could moderate).

    For international allocators evaluating Indian exposure in 2026: the sustained outperformance and the underlying structural strength make Indian equity exposure a legitimate component of EM allocations, but the entry valuation matters significantly. Investors with no existing Indian exposure face the question of whether to build positions at current premium multiples or wait for cyclical pullbacks that may or may not arrive. Investors with substantial existing Indian exposure that has accumulated significant gains face the question of whether to take profits or maintain positions through what may be continued outperformance.

    The honest position is that India remains structurally one of the most attractive long-term EM exposures despite current valuation concerns, that the specific risks are manageable but not negligible, and that the trade has been running for long enough that the marginal new dollar deployed into Indian equities should be priced with awareness of how far the structural case has already been recognised by the market. The next several years will test whether the premium valuations can be sustained or whether the trade enters a consolidation phase that allows the fundamentals to grow into the multiples.

  • Enterprise SaaS in the Agentic AI Era: Salesforce, ServiceNow, and Workday Are All Defending Different Vulnerabilities.

    Enterprise SaaS in the Agentic AI Era: Salesforce, ServiceNow, and Workday Are All Defending Different Vulnerabilities.

    The enterprise software market that built the public-cloud era — Salesforce, ServiceNow, Workday, Adobe, Atlassian, and the broader category of subscription software companies that charge per-seat pricing for business applications — faces the most significant strategic threat in its history from the agentic AI thesis. The argument is straightforward: if AI agents can perform substantial portions of the work that human users currently perform within these applications, then the business value of seat licences declines proportionally with the work that agents take over. A company that previously needed 100 Salesforce licences for 100 sales operations staff may need fewer licences if AI agents perform a meaningful share of the data entry, lead qualification, and pipeline management work that the licences supported.

    The financial implications for enterprise SaaS are existential in the most aggressive interpretation of this thesis. Per-seat pricing has been the primary revenue model for the category for over a decade, and the high-multiple valuations the enterprise software companies have achieved reflect the assumption that seat counts and per-seat prices would continue to grow with customer adoption and renewal cycles. An environment where seat counts plateau or decline because work has been agentified represents a fundamental change in the unit economics that justify those valuations.

    The honest analytical question is not whether agentic AI represents a real threat to enterprise SaaS — it does — but how different enterprise software companies are positioned to respond to that threat and which defences are actually working. The answers vary substantially across the category in ways that the broad “agentic AI disrupts SaaS” narrative does not capture.

    Salesforce’s Agentforce Response

    Salesforce has been the most aggressive enterprise software company in pivoting its product narrative toward agentic AI. Agentforce — the company’s AI agent platform — has been positioned as the response to the agentic threat: rather than losing seats to AI agents, Salesforce intends to charge for the agents themselves through a consumption-based pricing model that captures the work the agents do.

    The strategic logic is coherent. If AI agents are going to perform work that previously required human users, the customer relationship that delivers those agents to the enterprise can capture revenue from the agent usage itself rather than from the human seats the agents displace. Salesforce’s incumbent customer relationships — the deep integration of Salesforce into enterprise sales, service, and marketing operations — provide the distribution channel through which Agentforce can be deployed to existing customers without requiring them to integrate with a new vendor.

    The execution challenge is whether Agentforce can deliver agent performance that customers will pay for at prices that replace the revenue from seat licences being displaced. The early Agentforce deployments have demonstrated proof of concept in specific use cases — customer service automation, sales lead qualification, account management workflows — but the conversion from seat-based revenue to agent-consumption revenue has been gradual rather than rapid. Salesforce’s reported revenue mix continues to be dominated by traditional seat licences, with Agentforce representing a smaller but growing component.

    The Salesforce stock performance in 2025 and 2026 has reflected market scepticism about the pace at which Agentforce can replace the seat revenue that may erode. The shares have lagged the broader software sector even as Salesforce has reported solid headline growth, with valuation multiples compressed to levels significantly below the company’s historical norms.

    ServiceNow’s Different Bet

    ServiceNow has pursued a different strategy that emphasises the platform integration angle rather than the agent product angle. ServiceNow’s Now Platform serves as the workflow infrastructure for enterprise IT, employee service, customer service, and an expanding set of horizontal use cases. The company’s positioning is that AI agents need an enterprise workflow substrate to operate within — visibility into the data, integration with the systems, and orchestration of the actions that agents need to perform — and that ServiceNow provides that substrate.

    The strategic argument is structural. AI agents that perform business work need to interact with enterprise systems (HR systems, IT service management, customer service tools, finance applications) that ServiceNow already integrates with. An agent that wants to take action on behalf of a user — file an HR request, resolve an IT ticket, update a customer record — operates through the workflow infrastructure that platforms like ServiceNow provide. The agent does not displace ServiceNow’s value proposition; it requires ServiceNow’s value proposition to function.

    The investor reception of this thesis has been more favourable than Salesforce’s positioning. ServiceNow’s stock has performed substantially better than Salesforce over the past two years, with valuation multiples remaining elevated as growth has sustained at high rates. The bull case is that ServiceNow’s platform position is structurally protected from agentic disruption because agents need platforms; the bear case is that the same dynamic could be replicated by competing platforms or by AI infrastructure providers that build their own workflow capabilities.

    Workday and the HR Application Layer

    Workday has been the most cautious of the major enterprise software companies in its AI messaging, which reflects both the company’s culture and the specific dynamics of the HR application category. HR software faces a different agentic dynamic than CRM or ITSM: the work that human resources professionals perform involves significant judgment, compliance considerations, and human-centric tasks that are harder to fully automate. The agentic threat to Workday is real but is concentrated in specific subcategories (payroll processing, benefits administration, talent acquisition automation) rather than across the breadth of the HR function.

    Workday’s response has been more measured: AI capabilities integrated into the existing application rather than a separate agent product, partnerships with AI infrastructure providers rather than a clear-positioned competing agent strategy, and emphasis on the data and workflow integration value of being the system of record for HR. The reception has been mixed — the stock has performed reasonably but has not benefited from any clear AI narrative that has supported other software companies.

    The structural question for Workday is whether the HR application category continues to require dedicated software at the scale that Workday’s valuation implies, or whether agentic capabilities reduce the breadth of dedicated HR software in ways that compress the category’s growth trajectory. The probable answer is somewhere in between — HR will continue to require dedicated software but the per-employee revenue may be pressured by automation of the higher-volume, lower-judgment tasks.

    The Adobe Case Study

    Adobe represents an interesting case study because the company’s primary competitive threat is not the agentic seat-displacement dynamic but the disruption of its creative software franchise by AI-native alternatives. Figma’s emergence as a collaborative design tool already pressured Adobe’s design business; the generative AI capabilities that have emerged for image, video, and design creation have created additional competitive pressure from new entrants.

    Adobe’s response has been a combination of Firefly (its generative AI platform integrated into Creative Cloud applications), continued investment in the broader Creative Cloud subscription, and the controversial Figma acquisition attempt that was abandoned after regulatory pressure. The execution has produced mixed results — Firefly is genuinely valuable for existing Adobe users but has not necessarily expanded the addressable market the way the original AI thesis implied, and the competitive pressure from AI-native creative tools has been more significant than Adobe’s initial defensive narrative suggested.

    The strategic lesson from the Adobe case is that defensive AI integration into existing products is not necessarily sufficient when the competitive threat comes from new entrants whose products are AI-native rather than AI-augmented. The same dynamic applies in principle to other enterprise software categories: the AI defenders may be protected from agentic seat displacement but may face different threats from AI-native entrants whose products are not bound by the constraints of legacy software architectures.

    The Hyperscaler Threat Vector

    The threat that may matter most across enterprise SaaS over a 5–10 year horizon is the hyperscalers’ move into application-layer AI. AWS’s Bedrock and the broader hyperscaler AI infrastructure, Anthropic’s enterprise positioning, and the AI agent capabilities that Google and Microsoft are building directly into their productivity stacks (Copilot in Microsoft 365, Workspace AI in Google) represent a structural threat to dedicated enterprise SaaS that operates above the application layer.

    The argument is that if Microsoft can build Copilot agents that perform sales operations work integrated with Outlook, Teams, and the broader Microsoft 365 stack, then a portion of the value that Salesforce currently delivers can be captured within the productivity software that enterprises already use. The same dynamic applies to Google Workspace for the segments of the workforce that operate primarily in Google’s productivity stack. The structural advantage of operating within the productivity layer where employees already work is significant for capturing agentic work that does not specifically require the dedicated enterprise SaaS application.

    This threat has not yet materialised at scale — Microsoft Copilot and Google Workspace AI are still in early enterprise deployment, and the integration depth with dedicated enterprise applications has limited the direct displacement so far. But the trajectory is concerning for the enterprise SaaS category because the hyperscalers have distribution, integration capability, and AI infrastructure advantages that the dedicated enterprise software companies cannot easily match.

    The Honest Investor Assessment

    For investors evaluating enterprise SaaS exposure: the category is not uniformly threatened, and the variation within the category is significant enough that selective positioning produces meaningfully different outcomes than category-level allocation. Platform plays like ServiceNow that benefit from agent infrastructure demand may continue to perform well even if traditional seat-licence pricing is pressured elsewhere. Application-layer plays like Salesforce face more direct seat-displacement risk and require the agent revenue conversion to work at the pace that justifies current valuations. Vertical-specific plays like Workday face category-specific dynamics that depend on how automation affects the underlying workforce in their target markets.

    The valuations across the category have compressed meaningfully over the past two years as the agentic AI thesis has been absorbed by the market. The current multiples imply lower growth expectations than the historical pattern suggested, which means that the equity outcomes depend significantly on whether the categories deliver against the lower expectations or whether they disappoint relative to even the reduced bar. The honest position is that selective enterprise SaaS exposure remains attractive but the simple buy-and-hold thesis that characterised the category during the cloud computing era is no longer sufficient — active assessment of each company’s agent strategy, its platform vulnerability, and its hyperscaler relationship is required to navigate the disruption that is genuinely under way.

    The Business Model Problem Nobody Is Actually Discussing

    Here is the thing about enterprise SaaS and agentic AI that most of the analysis misses: we are treating this as a product problem when it is actually a business model problem. The seat-licence model did not succeed because it was the best way to price software. It succeeded because it was the best way to price software given that humans were the users. Every licensed seat represented a human doing work. The value delivered scaled with headcount. The business model matched the underlying economic reality.

    What if we are wrong about what happens next? The conventional worry is that agents displace seats, so revenue falls. That assumes the future looks like the past minus some users. But the more interesting possibility is that enterprise software is about to discover that it does not actually know what it is selling. Is Salesforce selling access to CRM software? Or is it selling the ability to run sales operations at scale? If an Agentforce agent does the same work as a sales development representative, has Salesforce sold a seat or has it sold a service? The answer changes everything about how you price it, how you defend it, and how you justify the margins.

    Good ideas often look bad at first because they require abandoning something comfortable. For enterprise software companies, the comfortable thing is the subscription model with its predictable revenue and high net retention rates. The potentially good idea — and the one that companies like ServiceNow seem to intuit better than most — is that the value of enterprise software is not the software. It is the organised knowledge of business workflows that decades of implementation has encoded into the data and the configuration. Agents need that knowledge. They need to know how an enterprise’s specific sales process works, what the exception paths are, who has approval authority for which decisions, what the data actually means in context.

    The question no one is asking loudly enough is: what happens to the workplace itself when the interfaces that organise work — the CRM, the service desk, the project management tool — are no longer navigated by humans but by agents? The answer is probably that the organisational knowledge encoded in those systems becomes more valuable, not less. The software vendors that figure out how to charge for the knowledge substrate rather than for the access interface will survive the transition. Those that stay attached to the per-seat model as agents proliferate will find themselves in the same position as the telephone companies who insisted on charging per minute when Skype arrived. The call ends. The question is whether you saw it coming.

  • DeFi Lending Is Growing Up. Aave, Morpho, and the Institutional Credit Market Opportunity.

    DeFi Lending Is Growing Up. Aave, Morpho, and the Institutional Credit Market Opportunity.

    DeFi lending protocols were among the hardest-hit segments of the crypto market during the 2022 credit crisis. The collapse of Three Arrows Capital, Celsius, and Voyager — which had borrowed heavily through both centralised and decentralised lending channels — triggered liquidations, credit losses, and a reassessment of the risk models that underpinned on-chain credit markets. The protocols that survived, particularly Aave, did so because their over-collateralisation requirements and automated liquidation mechanisms worked largely as designed, even as centralised lenders that operated with opaque balance sheets imploded.

    By 2026, the DeFi lending market has rebuilt to multi-year highs in total value locked, but it has done so differently than the 2021 peak. The composition of borrowers and lenders has shifted meaningfully, the risk parameters are more conservative, and the protocol architectures have evolved in response to the failure modes that 2022 exposed. Understanding what has changed — and what risks remain — is essential context for the institutional capital that is now evaluating DeFi credit as a genuine financial product rather than a speculative experiment.

    Aave v3: The Incumbent’s Evolution

    Aave remains the largest DeFi lending protocol by total value locked across its deployments. The v3 upgrade introduced several risk management improvements that addressed weaknesses exposed in 2022: isolation mode for new or volatile assets that limits the collateral that can be borrowed against them; efficiency mode (e-mode) that allows higher loan-to-value ratios for correlated asset pairs where the collateral and borrowing asset are closely price-linked; and supply and borrow caps at the asset level that prevent individual assets from becoming systemically over-concentrated in the protocol’s risk exposure.

    The cross-chain deployment strategy has been Aave’s most significant growth lever in 2025 and 2026. Aave v3 deployments on Arbitrum, Base, Optimism, and Polygon have captured TVL from users and institutions operating on L2 networks, where lower gas costs make DeFi lending economically viable for smaller positions that would be uneconomical on Ethereum mainnet. The improving user experience on L2s from protocol upgrades like Pectra creates a positive flywheel for DeFi lending: better UX drives more users, more liquidity improves borrowing rates, better rates attract more institutional capital.

    GHO — Aave’s native stablecoin, overcollateralised against assets deposited in the protocol — is the protocol’s value capture mechanism beyond interest revenue. GHO’s integration into DeFi ecosystems as a stablecoin borrowing option gives Aave a revenue stream from stablecoin seigniorage that is separate from lending spreads. The performance of GHO as a stablecoin — maintaining its peg, growing adoption, and integrating into DeFi composability — is a meaningful indicator of Aave’s long-term business model strength beyond its core lending product.

    Morpho’s Modular Architecture and What It Offers Institutions

    Morpho has grown rapidly in 2025 and 2026 by offering a fundamentally different architecture from Aave’s monolithic pool model. Where Aave operates a unified liquidity pool with governance-set risk parameters that apply to all participants equally, Morpho’s architecture consists of isolated lending markets — Morpho Markets — with risk parameters set by market creators, and curated vaults — MetaMorpho vaults — where professional risk curators select which markets to deposit into and what collateral exposure to accept.

    This modularity is specifically valuable for institutional participants. An institutional lender that wants to lend USDC against only specific collateral types — tokenized Treasuries and wstETH, for example — can access a Morpho vault curated to exactly those parameters rather than being forced to accept the full collateral risk spectrum of a monolithic pool. The specialisation of risk is something institutional credit managers understand from traditional structured credit and find more legible than undifferentiated pool exposure.

    The curator model introduces a dependency that is worth scrutinising: the quality of a MetaMorpho vault depends on the quality of the curator’s risk management decisions. Curators who are overconfident about collateral quality or who select markets with high smart contract risk expose their vault depositors to losses that would not have occurred under Aave’s more conservative governance process. Institutional due diligence on Morpho exposure requires understanding not just the protocol’s own risk management but the specific curator’s track record and risk framework.

    The Institutional Capital Flowing In — and Why

    The institutional capital entering DeFi lending in 2026 is motivated by several genuinely interesting characteristics of on-chain credit markets. Interest rates in DeFi lending markets are set by supply and demand in real time, creating a transparent rate discovery mechanism that traditional credit markets lack. An institutional lender can observe borrowing demand, assess collateral quality, and price risk in a market where all positions are visible on-chain — a transparency that over-the-counter credit markets cannot match.

    The collateral quality evolution has also been significant. In 2021, DeFi lending was primarily collateralised by volatile crypto assets — ETH, wBTC, governance tokens — creating reflexive liquidation spirals when prices fell. In 2026, tokenized Treasuries, stablecoins, and liquid staking tokens (wstETH, cbETH) represent a larger share of high-quality collateral that DeFi lending protocols accept. The growth of tokenized real-world assets as DeFi collateral creates a credit quality tier that institutional lenders can engage with at risk parameters more analogous to traditional secured lending than to speculative crypto credit.

    The stablecoin ecosystem’s maturation provides the liquidity and settlement layer that institutional DeFi lending requires. Lending USDC or USDT against high-quality collateral and earning on-chain interest rates that often exceed equivalent off-chain money market rates is a genuine value proposition for capital that can tolerate the smart contract risk of the lending protocol — a calculation that institutional credit teams are now equipped to evaluate rather than reflexively declining.

    What the Risks Actually Are in 2026

    The 2022 crisis generated lessons that have improved DeFi lending risk management, but it did not eliminate the fundamental risks of on-chain credit. Oracle manipulation remains the most acute tail risk: DeFi lending protocols price collateral using on-chain price feeds (oracles), and an attacker who can manipulate those feeds can drain a protocol by borrowing against artificially inflated collateral. The oracle infrastructure has improved substantially — Chainlink’s decentralised oracle networks, protocol-specific oracle designs, and circuit breaker mechanisms all reduce the attack surface — but the risk is not zero and scales with the value at risk.

    Smart contract risk compounds across the protocol stack in ways that institutional investors need to understand explicitly. A depositor in a MetaMorpho vault is exposed to the smart contract risk of the Morpho protocol, the risk of the specific Morpho Market they are exposed to, potentially the risk of a liquid staking token’s contracts if that is the collateral, and the risk of the oracle system providing price feeds. Each additional layer multiplies rather than simply adds the smart contract risk surface.

    The analogy to restaking’s compound risk structure is instructive: just as restaking through EigenLayer stacks AVS slashing conditions on top of base Ethereum staking risk, DeFi lending stacks protocol-level smart contract risk on top of underlying asset custody risk. The yield in both cases compensates for this stacked risk; understanding whether the compensation is adequate requires understanding each layer explicitly rather than treating the combined yield as a simple market rate.

    The regulatory horizon for DeFi lending is the least certain variable. DeFi credit markets that involve identifiable borrowers, enforceable collateral arrangements, and institutional participants will eventually attract regulatory attention that tests whether permissionless smart contracts can serve as adequate substitutes for licensed financial intermediaries. Protocols that have built compliance-compatible architectures — KYC-gated lending pools, permissioned vaults for regulated participants, on-chain AML checks — are building toward a future where institutional DeFi lending can operate within regulatory frameworks rather than in the grey areas that current DeFi credit occupies. The transition to that regulatory environment will be uneven, and the protocols that have invested in compliance infrastructure will be better positioned to survive it than those that have treated regulatory engagement as irrelevant.

    The Maturation Thesis and Its Evidence

    DeFi lending’s growth back to multi-year TVL highs after the 2022 stress test is evidence that the core value proposition — transparent, over-collateralised, automated credit markets — survived its first major crisis and emerged with improved risk frameworks. The protocols that survived did so because their mechanisms worked as designed: liquidations processed correctly, over-collateralisation provided the cushion it was supposed to, and transparent on-chain positions prevented the information asymmetries that destroyed centralised lenders.

    The maturation thesis — that DeFi lending can grow into a significant institutional credit market alongside, rather than in competition with, traditional credit — is better supported by evidence in 2026 than it was in 2022. The remaining work is protocol-level: continuing to improve oracle security, smart contract auditing, and governance risk management; building the compliance infrastructure that institutional adoption at scale requires; and demonstrating through sustained performance across market cycles that the risk management improvements hold under conditions more severe than those already tested.

    Whether that maturation happens fast enough to capture the institutional credit opportunity before regulatory frameworks close around permissionless DeFi is the defining uncertainty. It is a race between protocol development and regulatory evolution that neither the DeFi community nor regulators can fully control, and it is playing out in real time across the lending markets that Aave, Morpho, and their competitors are building.

    What the Institutional Credit Narrative Shows Versus What the Records Say

    There is a difference between the story a protocol tells about itself and the documented history that its on-chain records contain. For Aave and Morpho, the institutional credit narrative is compelling: mature risk management, conservative parameters, over-collateralisation requirements that prevented the failures of 2022, and a growing cohort of institutional capital that is finally comfortable treating DeFi lending as a legitimate financial product. That narrative has enough evidence behind it to be worth taking seriously. But the investigation that this market deserves starts with the documents rather than the press releases.

    Aave’s liquidation record is, in fact, largely what the protocol claims it to be. During the March 2023 banking crisis, during the FTX collapse cascade in November 2022, and during the various smaller market dislocations of 2024 and 2025, Aave’s automated liquidation mechanisms functioned. The protocol did not take bad debt losses at the scale that its critics projected when TVL was contracting rapidly. That is genuine evidence, and it deserves acknowledgment. The risk management improvements in v3 — isolation mode, efficiency mode, per-asset supply and borrow caps — are documented in the governance forum, the technical specifications, and the on-chain parameter history. Auditing firms have reviewed them. The evidence base for Aave’s risk management is more robust than almost any centralised lender’s was in 2021.

    The questions worth pressing are narrower and more specific than a blanket critique of DeFi lending. First: the liquidation mechanisms work well under volatility conditions the protocol has already experienced. The 2022 collapse was severe but had a particular character — it was a contagion event driven by specific counterparty failures, not a correlated crash of all collateral assets simultaneously. An extreme correlated event — Bitcoin and Ethereum falling 60 percent in 48 hours while stablecoin pegs are simultaneously under pressure — has not been stress-tested in production. Second: the risk disclosures that institutional participants are operating under deserve scrutiny. The sophisticated family offices and treasury management operations that are allocating to Aave and Morpho vaults are making probability-weighted calculations about tail risk. What those calculations assume about correlated liquidity events in the collateral pool is not always disclosed in the marketing materials. Third: Morpho’s architecture is genuinely modular, but the curator system that is managing risk on behalf of institutional depositors is new enough that its governance and accountability structures have not been tested through a full credit cycle.

    None of this invalidates the institutional DeFi credit thesis. But the history of financial markets teaches one lesson more reliably than any other: the instruments that fail catastrophically are almost always the ones whose risk management was described as mature, whose documentation was thorough, and whose track record was clean — right up until the conditions that the documentation did not anticipate arrived. The question of how DeFi protocols capture value under competitive pressure is separate from but related to the risk question: protocols that are competing aggressively on yield will face structural pressure to relax risk parameters that currently look conservative. Watching what Aave’s governance does to its risk parameters over the next eighteen months will tell you more about the institutional credit thesis than any press release about institutional adoption milestones.

  • Kevin Warsh Just Became Fed Chair. The Market Is Pricing In Rate Hikes. What Stagflation Means for Risk Assets.

    Kevin Warsh Just Became Fed Chair. The Market Is Pricing In Rate Hikes. What Stagflation Means for Risk Assets.

    Kevin Warsh was confirmed and sworn in as Chair of the Federal Reserve in May 2026, stepping into the most contested monetary policy environment since Paul Volcker walked into a room with 18% inflation and decided to raise rates anyway. The comparison is not accidental. The word “stagflation” — the simultaneous presence of stagnant growth and persistent inflation — is being used openly by serious people now, not just as a tail-risk scenario but as a description of current conditions. Warsh inherits a Federal Reserve that is, depending on who you ask, either behind the curve, paralysed by a political environment that makes hiking deeply uncomfortable, or navigating one of the most structurally complex macroeconomic moments in a generation.

    What is certain is this: the bond market has already made its call. The question for investors, operators, and everyone who holds risk assets is whether the equity market has caught up.

    The Inflation Data Is Not Ambiguous

    Start with the numbers. April CPI came in at 3.8% year-on-year. PCE — the Fed’s preferred inflation gauge — printed at 3.5%. PPI, which measures producer prices and functions as a leading indicator of consumer inflation, rose 6% year-on-year, the fastest pace since 2022. These are not numbers that describe a transient spike. They describe an inflation environment that has stabilised well above the Fed’s 2% target with no clear trajectory downward.

    The Motley Fool’s May 26 review of the Fed’s latest inflation data noted that the combination of above-target CPI, elevated PCE, and surging PPI leaves Warsh with almost no credible case for loosening monetary policy in the near term. Schwab’s analysis, titled “Are You There, Inflation? It’s Me, Kevin Warsh,” framed the challenge bluntly: the new Fed Chair walked into a job where the headline numbers make the dovish case essentially indefensible.

    Warsh himself has previously argued that artificial intelligence is “structurally disinflationary” — a thesis that draws on the long-term productivity gains AI is expected to deliver to the economy. The argument is intellectually coherent as a multi-year view. It is deeply uncomfortable as an explanation for why CPI is at 3.8% and rising producer prices suggest it is not done climbing.

    The Energy Shock: Hormuz and What It Means for Supply-Side Inflation

    Underlying the persistence of current inflation is a supply-side shock that monetary policy cannot directly address. On February 28, 2026, the United States military struck targets in Iran. Iran’s response was the closure of the Strait of Hormuz — the 21-mile-wide chokepoint through which approximately 20 million barrels of petroleum pass every day, representing roughly 20% of global petroleum supply.

    The closure was not symbolic. It was operationally enforced. Energy markets responded immediately. Oil price spikes fed into transportation costs, manufacturing inputs, and consumer goods pricing within weeks. This is the classic supply-side inflation mechanism: a geopolitical disruption that raises input costs across the entire economy, with the effect then embedded into price expectations before monetary policy can even begin to respond. The Fed cannot build more oil tankers. It cannot reopen the Strait of Hormuz. It can only adjust the cost of money — and when inflation is being driven by a physical supply constraint, raising rates addresses the demand side while the supply side remains broken.

    This is the core of the stagflation dilemma Warsh faces. Stagflation is, at its heart, the product of supply-side shocks meeting an economy that cannot absorb them without generating persistent inflation. The oil embargoes of the 1970s created the same dynamic. The policy question — then and now — is whether to allow inflation to run while protecting growth, or to crush demand enough to bring inflation down at the cost of economic contraction.

    GDP at 1–2%: The Growth Side of the Equation

    The growth side of the equation is not healthy. US GDP is running at approximately 1–2% annualised growth — low enough that the economy is already operating with very thin margin for error. At 1–2% growth, the economy is technically expanding but at a pace that masks genuine weakness in interest-rate-sensitive sectors. Housing has been suppressed by elevated mortgage rates for two years. Business investment has slowed. Consumer spending is bifurcating between high-income households — which have remained resilient — and lower-income households, which are under significant pressure from both higher prices and the cumulative effect of rates that have been elevated for an extended period.

    The Fed’s dual mandate — maximum employment and price stability — becomes particularly difficult to navigate when both sides of the mandate are in tension. Hiking into 1–2% GDP growth is not a comfortable policy choice. The historical record suggests that aggressive rate hikes into a weak growth environment produce recessions. The question is whether the alternative — holding or cutting while inflation runs at 3.8% with PPI at 6% — risks entrenching inflation expectations in a way that produces a harder landing down the line.

    The Fed Minutes: Hikes Are on the Table

    The May 20 Federal Open Market Committee minutes removed any ambiguity about the direction of policy consideration. Rate hikes are explicitly on the table. US News reported that the minutes showed Fed officials discussing scenarios under which rate increases would be appropriate if inflation failed to moderate. This was not a hypothetical. It was a documented deliberation about a policy tool that the market had largely assumed was off the table as recently as early 2025, when the consensus view was that the next move would be a cut.

    The CME FedWatch tool has recalibrated accordingly. As of late May 2026, the probability of a rate cut at any upcoming meeting is essentially 0%. More significantly, the probability of at least one rate hike by year-end has risen above 33%. The market is now pricing two full rate hikes by March 2027. This is a complete inversion of the rate expectations environment that prevailed twelve months ago, when Fed funds futures were pricing 150-200 basis points of cuts over the following two years.

    The CNBC report from May 14 — “Bond market believes Fed behind the curve on inflation as Warsh takes over” — captured the bond market’s verdict precisely. Treasury yields at the longer end of the curve have risen to reflect the expectation that the Fed will be compelled to tighten further. The bond market typically moves ahead of Fed policy. It is currently pricing in a tightening cycle, not a pause.

    Ray Dalio’s Warning and the Stagflation Framework

    Ray Dalio, in comments reported by CNBC on April 27, offered one of the cleaner frameworks for thinking about what Warsh should do. Dalio’s view: the US has slipped into a stagflationary environment, and cutting rates in that environment would be a policy error. His argument is structural. When an economy is experiencing both demand-side weakness and supply-side inflation simultaneously, cutting rates stimulates demand without addressing supply — which means cutting accelerates inflation without meaningfully improving growth. The result is worse inflation expectations, a weaker currency, and an eventual tightening cycle that has to be far more aggressive than if policymakers had simply held the line.

    Dalio’s framework is derived from the 1970s experience, where the Federal Reserve under Arthur Burns repeatedly accommodated inflation rather than fighting it, leading to the deeply embedded inflationary expectations that Volcker then had to break with the most aggressive rate hikes in modern history. The lesson: the longer you wait to address supply-side inflation, the more demand-side tightening you eventually need.

    Warsh appears to understand this framework. His public statements since taking office have emphasised credibility and long-term inflation expectations management. He has not signalled any inclination to cut rates. What remains unclear is whether he will hike actively into weak growth or maintain rates at current levels and watch PPI data for evidence that producer price pressures are about to feed through more aggressively into consumer prices.

    What “Behind the Curve” Actually Means

    When CNBC reports that the bond market believes the Fed is “behind the curve,” the specific mechanism matters. Being behind the curve on inflation means that the Fed’s policy rate is lower than it needs to be to bring inflation back to target. When this happens, inflation expectations can become “unanchored” — meaning that households and businesses stop believing the Fed will succeed in hitting 2% and start pricing long-run inflation higher. Once expectations become unanchored, bringing inflation back to target requires a much more severe tightening cycle because you are not just fighting current inflation — you are fighting the expectation of future inflation embedded in every wage negotiation and every supply contract in the economy.

    The concern the bond market is expressing is not just about the current CPI number. It is about the trajectory: PPI at 6% feeding forward into consumer prices, an energy shock with no near-term resolution, and a new Fed Chair who has so far held rates steady while the data suggests tightening is warranted. If Warsh holds and CPI rises toward 4.5% or 5% over the next two quarters, the rate hiking cycle that would be required to correct that would be far more damaging to growth than two modest hikes taken preemptively now.

    Equities: Earnings Resilience vs. Multiple Compression

    The S&P 500 reported Q1 2026 blended earnings growth of 15.1% year-on-year. This is genuinely remarkable given the macro headwinds. Corporate America has demonstrated, repeatedly over the past three years, a capacity to grow earnings through cost management, pricing power, and productivity improvements that periodically surprises consensus estimates. The 15.1% blended growth number is not a statistical quirk — it reflects real revenue growth across multiple sectors, with technology, energy (benefiting from elevated oil prices), and healthcare among the notable contributors.

    But here is the critical distinction for equity investors: the shift from “cuts priced in” to “hikes priced in” is a multiple compression event, not a cashflow event. Corporate earnings can still grow — and based on Q1 data, they are growing — while P/E ratios contract. When the risk-free rate rises, every future cashflow is discounted at a higher rate. A company earning $10 per share that was valued at 22x earnings when the 10-year Treasury was at 3.5% is worth considerably less at 22x when that same Treasury is at 4.8%, because the opportunity cost of holding equity versus bonds has changed.

    This is the mechanism by which rate hike expectations can produce equity market weakness even during a period of strong earnings growth. The denominator of the valuation equation — the discount rate — rises, and even if the numerator (earnings) is growing, the resulting multiple contracts. Index-level performance may be compressed not because companies are earning less, but because investors are willing to pay less for each dollar of earnings when safer alternatives yield more.

    This dynamic also plays out unevenly across sectors. Long-duration growth equities — where a large proportion of the expected value lies in earnings many years in the future — are most sensitive to discount rate changes. Value equities and financials, which earn more in a higher rate environment, can outperform. The rotation from growth to value that characterises tightening cycles is not irrational; it reflects the mathematics of how future cashflows are discounted.

    Bonds and Credit: The Duration Problem

    The bond market’s response to rising rate expectations is straightforward but painful for existing holders. If the market is now pricing two hikes by March 2027, the price of bonds issued at lower coupon rates falls to compensate new buyers for the yield differential. Longer-duration bonds — those with 10-, 20-, or 30-year maturities — are most affected because the duration of their cashflows means each basis point of yield change produces a larger price movement.

    For institutional investors with significant fixed-income allocations — pension funds, insurance companies, sovereign wealth funds — the re-pricing of rate expectations in 2026 represents a portfolio impairment that is real even if it is unrealised on the balance sheet. The question for credit markets is whether higher yields eventually attract buyers who stabilise the market, or whether rising yields increase the cost of corporate refinancing enough to create credit stress in leveraged sectors.

    High-yield credit is particularly sensitive. Companies with floating-rate debt have already experienced significant increases in their interest expense over the past two years. A further hiking cycle would accelerate this effect. Sectors with high leverage — commercial real estate, leveraged buyout-backed companies, some energy producers — would face the most acute pressure.

    The Fiscal Context Warsh Inherited

    Warsh did not walk into this environment without context. He inherited an economy shaped by the historic expansion of US sovereign debt that preceded his appointment — a fiscal trajectory that has itself contributed to inflationary pressure through demand stimulus, and that constrains the Fed’s room to manoeuvre because higher rates increase the government’s debt-servicing costs on an expanding debt stock. The interaction between fiscal policy and monetary policy is more consequential now than at any point since the early 1980s.

    This creates a political dimension to Warsh’s decisions that is difficult to separate from the purely economic analysis. Rate hikes that are economically justified may be politically resisted in ways that complicate the Fed’s independence. Warsh will need to maintain the Fed’s credibility as an institution while navigating a fiscal environment in which the Treasury’s debt-servicing burden rises meaningfully with every 25 basis points of additional tightening.

    The Warsh Dilemma, Defined

    The core dilemma is this: hiking into a 1–2% GDP environment risks tipping the economy into a recession that was not inevitable. Holding rates in a 3.8% CPI, 6% PPI environment risks entrenching inflation expectations that will require an even more aggressive response later. There is no clean answer. There is no policy setting that delivers 2% inflation without any growth cost in a supply-side-shocked economy with elevated fiscal deficits and geopolitical disruption to global energy markets.

    What Warsh can do is communicate clearly, act preemptively enough to anchor expectations without front-running data, and avoid the error that Volcker’s predecessors made — allowing inflation to persist long enough that the eventual correction was far more painful than preventive tightening would have been.

    The market is telling him something. Two full hikes priced by March 2027, 0% probability of cuts, a bond market that believes the Fed is already behind: this is not the market asking for inaction. It is the market telling a new Fed Chair that his credibility will be established not by what he says, but by whether his policy choices align with the data in front of him.

    Risk assets are watching. Earnings growth provides a buffer. Multiple compression is already happening. The question investors are asking is not whether Warsh will hike — the data makes that probable — but whether he will hike enough, and soon enough, to prevent the stagflation dynamic from becoming self-reinforcing.

    The 1970s answer to that question was: no, the Fed did not act early enough, and the correction took a decade. The 2026 answer is still being written.


    Sources: CNBC, “Bond market believes Fed behind the curve on inflation as Warsh takes over” (May 14, 2026); US News, “Fed Minutes Suggest Interest Rate Hikes Are on the Table if Inflation Continues” (May 20, 2026); CNBC, “Ray Dalio says Kevin Warsh shouldn’t cut interest rates in a ‘stagflation’ era” (April 27, 2026); Yahoo Finance, “Kevin Warsh sworn in as Fed chair as inflation worries raise the volume on possible rate hikes”; Motley Fool, “The Latest Fed May Inflation Update Is In” (May 26, 2026); Schwab, “Are You There, Inflation? It’s Me, Kevin Warsh.”

  • Private Credit Hit $2 Trillion and Nobody Agreed on What It Was Worth. That Is Still True.

    Private Credit Hit $2 Trillion and Nobody Agreed on What It Was Worth. That Is Still True.

    Private credit has had one of the most remarkable institutional ascents of the post-2008 era. The asset class — broadly defined as direct lending and other non-bank credit arrangements between institutional investors and corporate borrowers — grew from roughly $500 billion in assets under management in 2015 to over $2 trillion by 2025. Blackstone, Apollo, Ares, Blue Owl, and dozens of other managers built institutional credit franchises that now touch pension funds, sovereign wealth funds, insurance companies, and an expanding list of retail-accessible vehicles through BDCs and interval funds.

    The growth story was compelling and largely validated: when public bond markets fell sharply in 2022 as rates rose, private credit portfolios marked flat or slightly positive because they are floating-rate instruments (interest income rises with rates) priced on infrequent mark-to-model schedules rather than daily market prices. Institutional investors who had allocated to private credit saw lower volatility in reported returns, collected higher current yields than public investment-grade bonds, and benefited from covenants that gave lenders more control over problem credits than public high-yield bonds typically allow.

    That story is true as far as it goes. It does not go as far as the subsequent rush of capital into the asset class implied. The combination of rapid growth, covenant loosening, higher-for-longer interest rates, and increasing complexity in the underlying exposure warrants a more careful look at what risks have accumulated in the $2 trillion stack.

    Mark-to-Model: The Volatility That Has Not Arrived Yet

    The most significant structural feature of private credit that investors need to understand is that reported returns and actual economic performance can diverge substantially until a credit event forces a realisation. Private direct loans are not traded on an exchange. They are valued by the lending manager, typically quarterly, using models that incorporate interest rates, comparable transaction multiples, the borrower’s financial performance, and the manager’s judgment about credit quality.

    This is not inherently dishonest — it is the nature of illiquid private markets. But it has two consequences that investors should take seriously. First, reported returns in private credit appear smoother than the actual economic risk of the underlying loans because mark-to-model valuations lag reality. A deteriorating borrower shows up in the loan’s value only when the manager decides to write it down, which happens more slowly and more gradually than a public bond price would reflect the same deterioration. Second, the absence of price discovery means that the market-clearing price for private credit — what someone would actually pay to buy these loans today — is unknown until someone tries to sell, which most LPs are contractually prevented from doing for years.

    The implication: private credit’s low reported volatility during 2022 to 2024 reflects the asset class’s accounting features as much as its underlying economics. If the same borrowers had issued public high-yield bonds rather than taking private direct loans, those bonds would have reflected their credit stress in real time. The private loans are priced by the people who own them, on schedules they control, using assumptions they select. That is a feature when markets are stable and a significant risk when they are not.

    Covenant Lite Crept Into Private Credit Too

    One of the original selling points of private credit was its covenant package. Unlike broadly syndicated loans (where lenders compete to provide capital and borrowers extract terms), direct lending was supposed to involve tighter maintenance covenants — financial tests that a borrower must pass quarterly — which give lenders early warning of deteriorating credits and the ability to intervene before value is permanently impaired.

    That differentiation has eroded. As capital flooded into private credit and managers competed for deal flow, covenant packages were progressively loosened. The industry term “covenant-lite” — which refers to the weaker covenant structures that emerged in broadly syndicated loans from 2013 to 2019 — has increasingly applied to direct lending transactions as well. Deals that would have had three or four maintenance covenants in 2016 frequently have one or none in 2024 and 2025.

    This matters because maintenance covenants are the primary early-warning and control mechanism that lenders use to manage deteriorating situations. When a borrower breaks a maintenance covenant, the lender can negotiate amendments, extract fees, tighten terms, or in extreme cases accelerate repayment. Without covenants, lenders have fewer levers to pull until the borrower is in actual payment default — which means less recovery of value in a restructuring because the situation has typically deteriorated further before anyone can act.

    The loosening happened gradually and competitively, driven by the same dynamic that loosened public leveraged loan covenants a decade earlier: too much money chasing too few acceptable deals, with each manager slightly relaxing terms to win the transaction. The aggregate result is a private credit market that is structurally less protected than its reputation for careful direct lending implies.

    Higher-for-Longer Rates as a Double-Edged Variable

    Private credit is a floating-rate asset class. When base rates rose from near-zero to over 5 percent in 2022 and 2023, private credit lenders collected dramatically higher interest income. A private credit portfolio yielding SOFR plus 500 basis points went from yielding roughly 5.5 percent to yielding over 10 percent as SOFR rose. For lenders, this was a windfall.

    For borrowers, it was the opposite. Private credit borrowers are typically private equity-owned businesses with significant leverage — EBITDA multiples of 5x to 7x or higher in many cases. The same rate increase that boosted lender income simultaneously raised interest expense for those borrowers by multiple percentage points annually. A business that was servicing its debt at 6 to 7 percent interest suddenly owed 10 to 12 percent, with no change in its underlying operating performance required to trigger stress.

    The Fed’s constrained cutting path means that this elevated interest expense environment persists longer than borrowers may have originally modelled when they took on the debt. Many private equity-backed businesses that took direct loans in 2021 and 2022 anticipated a refinancing environment by 2024 or 2025 that has not materialised at terms that reduce interest burden meaningfully. The extend-and-pretend dynamic — where managers roll loans rather than recognise impairments — has become visible in the vintage cohort data for 2021 and 2022 originations.

    The fiscal backdrop matters at the margin too. Sustained fiscal expansion keeps term premium elevated and makes the rate normalisation that private equity borrowers need for comfortable refinancing more distant than it might otherwise be. That is a second-order effect, but directionally adverse for the credit quality of the most leveraged borrowers in the private credit stack.

    The Denominator Effect and Capital Allocation Reality

    When public equity markets fell in 2022, private assets — which are not marked down commensurately — became a larger percentage of total institutional portfolios than investors had targeted. A pension fund targeting 20 percent private markets exposure suddenly found itself at 25 percent as public equity fell and private marks held flat. This “denominator effect” caused many LPs to slow new commitments to private credit as they tried to rebalance toward target allocations.

    That pressure has eased as public markets recovered in 2023 to 2025, but it highlighted a structural feature of private credit allocations: they are sticky in ways that can become problems. An LP that committed $500 million to a private credit fund in 2021 cannot exit that position at will. The lockup periods are typically five to ten years. If the LP needs liquidity, it must access the secondary market — where private credit fund stakes are sold at discounts that vary widely depending on the credit quality of the underlying portfolio and overall market conditions.

    The secondary market for private credit fund interests has grown, but it is still thin relative to the size of the asset class. Bid-ask spreads on fund interests can be 10 to 20 percent or more of NAV in stressed environments. Investors who relied on private credit’s high reported yields and low volatility without fully pricing in the liquidity premium — the compensation for accepting a multi-year lockup — may find that the effective yield was lower than it appeared once liquidity costs are factored in.

    What the Stress Scenarios Look Like

    The risks in private credit are not evenly distributed across the asset class. Infrastructure-adjacent direct lending, real asset-backed credit, and investment-grade private placements carry substantially less risk than the sponsor-backed leveraged buyout direct lending that most institutional investors associate with “private credit.” The risk conversation needs to be segmented.

    The segment that warrants the most scrutiny is the private equity-backed direct lending market for mid-market and upper-middle-market US and European businesses. These are the deals most affected by covenant loosening, leverage levels, and rate sensitivity. In this segment, payment-in-kind (PIK) rates — where interest is added to the loan balance rather than paid in cash — have risen across multiple managers’ portfolios. PIK is not inherently a distress signal, but rising PIK rates across a portfolio indicate that borrowers are conserving cash, which is consistent with businesses under margin pressure from higher interest costs.

    A realistic stress scenario does not require a recession. It requires only that a meaningful fraction of 2020 to 2022 vintage private credit deals fail to refinance at acceptable terms by 2026 to 2027, forcing restructurings that crystallise losses currently sitting in marks that have not been adjusted. The losses would then flow through to LP capital accounts over 2027 and 2028, with the standard eighteen-month to two-year lag between economic event and reported portfolio impairment.

    What Institutional Investors Should Be Doing Differently

    The case for private credit as an asset class is not eliminated by these risks. Floating rate exposure, illiquidity premium, and covenants — even weakened ones — still provide genuine portfolio benefits in the right context. The problem is not private credit as a concept; it is private credit as deployed at scale, with loosened protections, in a higher-for-longer rate environment, with portfolios valued by managers who have strong incentives to delay impairment recognition.

    Institutional investors with significant private credit allocations should be conducting vintage year analysis — understanding specifically what credit risk profile, what covenant package, and what rate sensitivity their 2020 to 2022 vintage loans carry, separately from their overall AUM figures. They should be stress-testing their liquidity assumptions: if they need to access capital from their private credit allocations before the fund term, what is the realistic secondary market discount and timeline?

    They should also be interrogating manager practices around PIK, extension requests, and covenant amendment frequency — all of which are leading indicators of credit stress that should show up before formal impairment. The managers who are most transparent about these metrics in a deteriorating environment are also typically the ones best positioned to manage through it.

    Private credit at $2 trillion is too large and too heterogeneous to be treated as a monolithic risk. The right question is not whether the asset class is dangerous but which parts of it, in whose hands, with what underlying borrower quality and covenant protection, are carrying risks that reported returns are not yet reflecting. That question is harder to answer than the quarterly statements suggest — which is precisely why it deserves to be asked more carefully.


    The Structural Story That Quarterly Marks Cannot Tell

    The private credit market has produced a decade of returns that look, on paper, like a solved problem. Mid-teens yields, low reported default rates, minimal volatility — the kind of numbers that asset allocators present to investment committees with confidence. What the quarterly marks cannot tell you is whether those numbers reflect what the assets are actually worth, or whether they reflect what the managers have chosen to report that the assets are worth.

    This is the narrative problem at the heart of private credit. In public markets, price discovery happens continuously and involuntarily. A company’s bonds trade and the market posts a number. Private credit has no such mechanism. The valuation is an opinion issued by the same party that stands to benefit from a higher number — and the investor who receives that opinion has, in most cases, limited ability to independently verify it. The quarterly mark is a statement about the manager’s confidence in the borrower, filtered through the manager’s own incentive structure, delivered to an investor who cannot see the underlying loan book in enough detail to disagree.

    Michael Lewis spent years documenting the mechanisms by which financial institutions obscure risk from the people who are supposed to be bearing it. The private credit market has produced its own version of that problem: not through fraud in most cases, but through structure. The opacity is built into the product. Investors accept quarterly marks because there is no alternative. Managers provide optimistic marks because the incentives point that way. The system functions smoothly until it meets a credit event large enough to demand honest marking — and then the gap between the reported figure and the actual figure becomes visible all at once.

    The $2 trillion scale of this market means that the gap, when it appears, will not be confined to the books of a single manager. Private credit has become a systemic exposure for pension funds, insurance companies, and sovereign wealth vehicles — pools of capital whose beneficiaries were not offered a vote on whether to bear institutional credit risk at this scale. The structural story the quarterly marks cannot tell is the one about what happens when those investors, simultaneously, discover that the marks were more optimistic than the underlying assets deserve.

  • Bitcoin Depot Went Bankrupt. Its CEO Blamed the Regulators.

    Bitcoin Depot Went Bankrupt. Its CEO Blamed the Regulators.

    On May 18, 2026, Bitcoin Depot — until recently the largest Bitcoin ATM operator in North America, with 9,276 kiosks across the United States, Canada, and Australia — filed for Chapter 11 bankruptcy protection in the U.S. Bankruptcy Court for the Southern District of Texas. The filing was voluntary. The entire ATM network was taken offline the same day. The company, which had been listed on the Nasdaq since 2023 at a peak valuation of $1.6 billion, was worth approximately $8.9 million at the time of filing. The stock fell 75% in a single trading session.

    Alex Holmes, who had been appointed chief executive of Bitcoin Depot exactly two months earlier, issued a public statement the day of the filing. “States have imposed increasingly stringent compliance obligations,” Holmes wrote, “including new transaction limits, and in some jurisdictions, outright restrictions or bans on BTM operations; and operators have faced increasing litigation and regulatory enforcement. These developments have materially affected Bitcoin Depot’s business and financial position. Under these circumstances, the Company’s current business model is unsustainable.”

    The statement is a document worth reading carefully — not for what it reveals about Bitcoin Depot specifically, but for what it demonstrates about a failure pattern that has run through crypto’s leadership class for a decade. The company collapsed. The explanation offered was the regulatory environment. The accountability question — what decisions, made by whom, over what period, produced this outcome — was absent from the statement entirely. It was not an oversight. It is the script.

    The Arc: From $1.6 Billion to $8.9 Million

    Bitcoin Depot was founded in Atlanta in 2016 by Brandon Mintz. The original premise was straightforward: cash-to-crypto conversion terminals, positioned in convenience stores and gas stations, targeting users who did not have bank accounts or preferred cash transactions. The machines charged a significant premium — typically 15 to 25 percent above spot price for Bitcoin — but they offered something that crypto exchanges at the time did not: immediate, cash-based access without identity verification requirements beyond a phone number.

    The model scaled. By the early 2020s, Bitcoin Depot had established itself as the volume leader in a fragmented market. The crypto bull cycle of 2020–2021 expanded the addressable market for crypto-adjacent financial services, and Bitcoin ATM operators benefited from the retail frenzy. Mintz positioned the company as a financial inclusion play — bringing Bitcoin access to the unbanked — a narrative that travelled well in both crypto circles and with the institutional investors who would later fund the company’s growth.

    In 2023, Bitcoin Depot completed a Nasdaq listing via merger with GSR II Meteora Acquisition Corp, a special purpose acquisition company. The SPAC vehicle gave Bitcoin Depot a public market valuation without the scrutiny of a traditional IPO process. At peak, the valuation reached $1.6 billion. Mintz’s narrative — Bitcoin ATMs as financial inclusion infrastructure — was being priced as though the unit economics, the regulatory environment, and the user base were all stable. They were not.

    By 2025, the warning signs were visible in the financial statements for anyone who looked at them. Revenue was declining. The fraud problem at Bitcoin ATMs industry-wide was becoming impossible to ignore: the Federal Trade Commission reported $389 million in losses from crypto ATM scams in 2025 alone, more than triple the figure from 2020. The machines were being used systematically to extract cash from fraud victims — predominantly elderly people who had been coached by scammers to withdraw their savings and feed them into Bitcoin ATM terminals that would transmit the funds overseas beyond recovery. Bitcoin Depot’s machines were a significant part of this infrastructure.

    In August 2025, Alex Holmes — a sixteen-year MoneyGram veteran, eight of those as chief executive — joined Bitcoin Depot’s board. In March 2026, the previous CEO, Scott Buchanan, departed. Holmes was appointed to replace him. Two months later, the company filed for bankruptcy. The stock price that had once implied a $1.6 billion enterprise was trading at $0.75.

    Statement vs documented record

    What the Statement Claims and What It Does Not

    Holmes’ bankruptcy statement is, taken at face value, partially accurate. The regulatory environment for Bitcoin ATMs did tighten materially in 2025 and 2026. Tennessee enacted legislation banning BTM operations, effective July 1, 2026. Indiana had previously enacted similar restrictions. Other states were considering equivalent measures. Transaction limits — caps on how much a single user could transact at a Bitcoin ATM within a given period — were imposed in multiple jurisdictions as regulators attempted to limit the dollar value of fraud that could flow through the terminals.

    But the statement’s framing — that regulatory enforcement was something that happened to Bitcoin Depot, an external force that made an otherwise viable business model unsustainable — requires accepting a premise that the underlying legal record does not support.

    In February 2025, the attorneys general of Massachusetts and Iowa filed a lawsuit against Bitcoin Depot. The complaint alleged that Bitcoin Depot’s machines had been used to facilitate approximately $20 million in losses to hundreds of state residents, the majority of them elderly. Iowa Attorney General Brenna Bird specifically highlighted that investigators had found scam operators identifying victims through obituaries — targeting recently widowed people who were financially inexperienced, emotionally vulnerable, and willing to follow instructions from callers who presented themselves as bank officials, government agents, or romantic partners.

    The scam structure was consistent and repeatable. A victim would receive a call instructing them to withdraw cash from their bank account. The caller — presenting as a representative of a financial institution, a tax authority, or a law enforcement body — would direct the victim to a nearby Bitcoin ATM. The victim would feed the cash into the machine. The funds would be transmitted to a crypto wallet controlled by the scammer, typically outside the United States. The transaction was irreversible. The victim had no recourse.

    Bitcoin Depot’s machines processed a meaningful share of these transactions. The regulatory response Holmes described as “increasingly stringent” was, at least in part, a direct legal and legislative reaction to the company’s documented role in that process.

    The 23% Commission and the Incentive Structure It Created

    Iowa’s investigation into Bitcoin Depot’s operations produced one figure that deserves more attention than it has received in the coverage of the bankruptcy: the commission rate. According to the Iowa Attorney General’s findings, Bitcoin Depot retained approximately 23 percent of transaction amounts processed through its machines.

    This matters because it establishes the incentive structure under which the company operated. A business that retains 23 percent of each transaction has a direct financial interest in processing as many transactions as possible. A business that retains 23 percent of each transaction and charges fees on top of that — Bitcoin Depot’s fee structure commonly ran to 15–25 percent of the transacted amount — had a revenue model that was indifferent to the source of the cash being inserted. From the perspective of the terminal’s economics, a $3,000 transaction by a fraud victim was worth exactly the same as a $3,000 transaction by a legitimate user. The machine did not distinguish. The commission did not distinguish.

    This is not a claim that Bitcoin Depot designed its business to serve fraud. It is a claim that the business model created no structural incentive to prevent fraud, and that in the absence of structural incentives to prevent fraud, fraud proliferated. The distinction matters because it defines where the accountability sits: not in individual malicious intent but in the design decisions that shaped what the company would and would not do. Companies that process cash transactions at scale in categories known to attract fraud are responsible for the fraud controls they build — or decline to build — into those transactions.

    When Holmes’ statement describes the regulatory environment as having made the business model “unsustainable,” a more precise framing would be: the regulatory environment attempted to impose fraud controls that the business model had not voluntarily adopted, and those controls — transaction limits, enhanced identity requirements, reporting obligations — made the high-volume, low-friction transaction processing on which the revenue depended significantly harder to execute. The regulatory intervention was, in this reading, an attempt to impose costs that the company had externalised onto fraud victims.

    The Leadership Carousel Before the Fall

    The bankruptcy filing named Alex Holmes as chief executive. Holmes had been in the role for sixty days. He was not responsible for the decade of operating decisions that produced the outcome he was managing. He was responsible for the statement he chose to issue, which attributed the company’s collapse to a hostile external environment while omitting any analysis of the internal decisions that preceded and caused that environment.

    The more relevant accountability question concerns Brandon Mintz, who founded the company in 2016 and led it through the period in which the fraud problem grew from an acknowledged industry risk to a documented legal liability. Mintz had transitioned to a non-executive board role before the bankruptcy — a transition described in company communications as providing “strategic continuity and institutional knowledge as the company executes its next phase.” The timing of that transition, relative to the deteriorating legal position and the regulatory pressure building from the AGs’ investigation, is part of the record. Founders who transition to non-executive roles in the period preceding a crisis are a consistent feature of crypto’s accountability record.

    Scott Buchanan, the CEO who preceded Holmes, departed in March 2026. The company’s financial trajectory by that point — revenue already declining steeply, the AGs lawsuit more than a year old, regulatory bans advancing through state legislatures — was not a surprise to anyone examining the operational data. What changed in March 2026 was not the situation. What changed was who would be publicly associated with explaining it.

    Holmes, the MoneyGram veteran brought in to manage the wind-down, inherited a position with no good options and chose to characterise those options in terms of regulatory hostility. This is not an unusual choice. It is, in fact, the default choice. The industry has rehearsed it enough that the script arrives pre-written.

    The Strongest Case for the Regulatory Argument

    There is a version of the regulatory story that deserves honest engagement, because it is not entirely wrong.

    The regulatory response to Bitcoin ATM fraud has been blunt in ways that do not necessarily distinguish between operators who built inadequate fraud controls and operators who invested in compliance infrastructure. Tennessee’s ban on BTM operations does not exempt companies that had voluntarily implemented enhanced due diligence. Indiana’s restrictions preceded the worst of the fraud numbers and were enacted without a framework that would allow compliant operators to continue. Several states have moved toward prohibition rather than toward the kind of transaction-limit and reporting regimes that would allow legitimate cash-to-crypto conversion to continue under tighter controls.

    A crypto ATM industry that had collectively invested in robust fraud detection — real-time monitoring for scam-pattern transaction sequences, proactive communication to users about common fraud types, lower transaction caps voluntarily implemented, integration with financial institution fraud alert systems — would have a more defensible position against this argument. Some of the regulatory overreach claim has merit: prohibition is a lazy policy response compared to regulated compliance frameworks, and it removes a service that does have legitimate users, particularly in unbanked communities that Bitcoin Depot spent years positioning itself as serving.

    This counterargument holds its form until it makes contact with the specific facts of the Bitcoin Depot case. The question is not whether regulatory overreach exists in the BTM sector in the abstract. The question is whether Bitcoin Depot’s collapse was primarily caused by that overreach, or whether the regulatory response was itself a consequence of documented conduct that the company had declined to address. Iowa’s 23 percent commission finding, the $20 million in losses to elderly residents through the company’s machines, the AGs’ lawsuit filed fifteen months before the bankruptcy — these are not the story of a compliance-investing company swept away by disproportionate enforcement. They are the record of a company whose fraud exposure was documented, litigated, and ultimately fatal.

    Pattern of systemic failure

    The Pattern Beneath the Story

    Bitcoin Depot is not notable because it is unusual. It is notable because it is representative.

    The accountability pattern that produced Holmes’ statement — regulatory environment cited, internal decisions omitted, leadership transition before the crisis, SPAC credentialism providing institutional legitimacy without institutional scrutiny — has appeared in enough crypto collapses to constitute a playbook rather than a coincidence. Sam Bankman-Fried, whose company FTX collapsed in November 2022 after the misuse of customer funds on a scale that resulted in a 25-year criminal sentence, has continued to post claims from prison that FTX was never technically insolvent and that bankruptcy professionals mismanaged the estate. Do Kwon, whose Terraform Labs algorithmic stablecoin collapsed and erased approximately $40 billion in market value, received a fifteen-year sentence after pleading guilty to fraud charges and has spent years constructing alternative explanations for what the courts found to be deliberate misrepresentation.

    The pattern is not that every failed crypto company was engaged in fraud. Many were not. The pattern is that the public explanation offered by leadership for why the company failed consistently locates the cause outside the leadership’s control — in market conditions, in regulatory hostility, in the behaviour of counterparties, in the speed of adoption curves. The question of what the leadership decided, when, and with what information, is structurally absent from these explanations. When it does appear, it appears in the context of what the leadership tried to do rather than what it failed to prevent.

    Morgan Housel’s observation in The Psychology of Money that people construct narratives about outcomes to match the roles they want to occupy in those narratives applies here with particular force. The founder who built a company that became an instrument of elder fraud is not a story that any founder would choose to tell about themselves. The founder who built a company that was destroyed by an overreaching regulatory environment is a story with a villain, a victim, and a clear allocation of responsibility that happens to exclude the person telling it. The story is not necessarily false in every particular. It is selective in the particulars it includes.

    What the crypto industry’s record of leadership accountability looks like — when examined against the documented timeline of decisions rather than the post-collapse narrative — is a class of executives who were credentialled into authority through a combination of educational background, early-cycle capital access, and the ambient optimism of an industry that had never experienced a full cycle of failure. The vetting that would have asked whether the people making large operational decisions had demonstrated relevant competence in high-stakes financial environments did not happen at scale, because the capital was available and the narrative was compelling and the cycle had not yet turned.

    It has now turned. Repeatedly. The question of whether the industry draws the right lessons from the turning depends on whether the post-collapse explanations are accepted at face value or read against the record. Bitcoin Depot’s record — a 23 percent commission model, documented fraud facilitation, a regulatory lawsuit filed fifteen months before the bankruptcy, and a public statement that attributed the collapse to the regulators who brought that lawsuit — is a useful test of which reading the industry prefers.

    What Due Diligence Would Have Found

    The investors who provided capital to Bitcoin Depot through the SPAC process in 2023 were investing in a company whose fraud exposure was, in retrospect, visible in the available data. The FTC had been publishing crypto ATM fraud statistics for several years. The pattern of elderly victims using Bitcoin ATMs to transfer cash to scammers was documented in law enforcement reports, consumer protection bulletins, and investigative journalism well before the Iowa and Massachusetts AG lawsuit was filed. The commission structure — high fees plus retained percentage of transaction value — was disclosed in the company’s financial statements.

    The due diligence question is not whether anyone could have found this information. It is whether the investors who provided capital asked the right questions about it. The operational gaps that standard diligence packets fail to surface include exactly this category of risk: the business model incentive structure that creates foreseeable but unacknowledged liabilities. A company that retains 23 percent of transactions and charges 15–25 percent fees is a company with a strong financial interest in transaction volume irrespective of transaction quality. That interest, combined with a fraud-vulnerable user profile and a regulatory environment that was beginning to respond to documented harm, was the forward-modelled risk. It was not priced.

    The SPAC vehicle added a specific complication. Traditional IPO processes subject companies to underwriter due diligence, SEC review of registration statements, and a prospectus disclosure process that creates legal liability for material omissions. SPAC mergers, particularly in the 2020–2023 period, compressed or bypassed elements of that scrutiny. Bitcoin Depot’s path to a $1.6 billion public valuation was shorter, faster, and less adversarial than the conventional IPO process would have produced. That is a feature of the SPAC vehicle that its promoters consistently presented as an advantage and that turned out, in this as in many other cases, to be a liability for the investors who received shares at that valuation.

    What This Case Tells Us About the Industry’s Leadership Problem

    The argument being made here is not that Bitcoin ATM companies are inherently fraudulent, or that every founder who built a company in the crypto space and watched it fail was responsible for that failure through negligence or malfeasance. The argument is narrower and more specific: the pattern of accountability in crypto’s leadership failures has a consistent shape, and that shape tells us something about who the industry recruited, how it vetted them, and what it permitted them to do with other people’s money.

    The shape is this: founders are recruited or self-select into positions of operational authority on the basis of narrative skill and credentialled background rather than demonstrated operational competence in the domain they are entering. Financial technology at scale requires specific expertise in fraud risk, regulatory navigation, compliance infrastructure, and the relationship between a business model’s incentive structure and its foreseeable externalities. Bitcoin Depot’s business model, as documented in regulatory findings, had a direct and predictable relationship between its commission structure and the fraud it facilitated. Recognising and addressing that relationship was not a heroic act of foresight — it was the kind of operational analysis that a competent leadership team in a financial services-adjacent business would have conducted as a matter of course.

    The amateur leadership problem in Web3 is precisely this gap between the credential and the competence. Mintz built Bitcoin Depot to a $1.6 billion valuation. That achievement is real. What is also real is that the machine network he built generated 23-percent-commission revenue from transactions that included elderly fraud victims being directed to those machines by scammers who had read their spouses’ obituaries. The distance between those two facts — the valuation and the commission structure — is where the accountability question lives. The post-collapse statement chose the former and omitted the latter. What professional leadership in Web3 actually requires is the willingness to answer for both.

    FAQ

    What was Bitcoin Depot?
    Bitcoin Depot was North America’s largest Bitcoin ATM operator, founded in Atlanta in 2016 by Brandon Mintz. At its peak it operated 9,276 kiosks across the United States, Canada, and Australia. It completed a Nasdaq listing via SPAC merger in 2023 at a peak valuation of $1.6 billion. It filed for Chapter 11 bankruptcy on May 18, 2026, with a market value of approximately $8.9 million.

    Why did Bitcoin Depot file for bankruptcy?
    CEO Alex Holmes’ public statement attributed the filing to “increasingly stringent compliance obligations” and a hostile regulatory environment. The underlying financial record shows Q1 2026 revenue collapsed 49.2% year-over-year, a $9.5 million operating loss, and an 85% decline in gross profit. The company also faced an active lawsuit from the attorneys general of Massachusetts and Iowa alleging the facilitation of $20 million in fraud against elderly residents.

    What was the Iowa AG investigation’s key finding?
    Iowa Attorney General Brenna Bird’s investigation found that Bitcoin Depot retained approximately 23 percent of transaction amounts processed through its machines. The investigation also documented that fraud operators were identifying victims through obituaries, targeting recently widowed people. Iowa and Massachusetts filed a joint lawsuit against Bitcoin Depot in February 2025 — fifteen months before the bankruptcy filing.

    What was the SPAC listing and why does it matter?
    Bitcoin Depot went public via merger with a special purpose acquisition company (GSR II Meteora Acquisition Corp) rather than a traditional IPO, reaching a Nasdaq listing at a $1.6 billion valuation. SPAC mergers in this period faced lighter due diligence requirements than traditional IPO processes. The compressed scrutiny meant the documented fraud exposure, the commission structure, and the regulatory risk were not stress-tested against the valuation in the way a conventional listing process would require.

    Is the regulatory blame argument entirely wrong?
    No. State-level BTM bans — Tennessee, Indiana, others — have been blunt instruments that do not distinguish between compliant and non-compliant operators. A better-designed regulatory framework would have set compliance standards rather than enacted prohibition. The counterargument has merit in the abstract. It does not explain why Bitcoin Depot specifically failed, given that the regulatory response was a documented consequence of the company’s own conduct record, not an independent variable applied uniformly across operators.

    Sources

  • Ethereum Staking Yields Are Real. BlackRock’s ETHB Made Them Institutional. The Gap Is in What Investors Expect.

    Ethereum Staking Yields Are Real. BlackRock’s ETHB Made Them Institutional. The Gap Is in What Investors Expect.

    BlackRock’s ETHB — the iShares Ethereum Trust with staking — began trading on the Nasdaq in March 2026, becoming the first US-listed exchange-traded product to pass staking yield through to shareholders. At launch, net yield to investors was projected in the 1.9–2.2% range after fees, representing the native Ethereum staking yield of approximately 2.8–3.5% minus the fund’s expense ratio and the costs embedded in BlackRock’s custodian and staking infrastructure arrangements. The product attracted meaningful inflows in its first weeks and was described by multiple financial media outlets as a milestone: institutional-grade yield from Ethereum’s proof-of-stake mechanism, delivered in a familiar regulatory wrapper to investors who would not or could not hold native ETH.

    The milestone framing is accurate as far as it goes. ETHB is genuinely the first, the yield is genuinely from staking, and the wrapper is genuinely accessible to retirement accounts, institutional mandates, and advisors who cannot hold spot crypto on behalf of clients. But the milestone framing obscures a yield hierarchy that matters considerably for investors trying to understand what they are actually buying.

    At the time of ETHB’s launch, 35.86 million ETH was staked across the network — approximately 29.5% of total circulating supply. Liquid staking protocols like Lido were distributing yields in the 2.8–3.1% range. Ethereum DeFi vaults using staked ETH as the base asset were yielding 8.28% on benchmark monitoring services. Native restaking protocols via EigenLayer were offering variable incremental yield on top of the staking base. The spread between ETHB’s 1.9–2.2% net yield and the available on-chain yield on the same underlying asset is not a product deficiency — it is an accurate reflection of the risk, complexity, and counterparty exposure that the on-chain alternatives carry. But investors buying ETHB as a “yield” product without understanding that hierarchy are making an uninformed allocation decision.

    The Yield Hierarchy, Explained

    Ethereum’s proof-of-stake mechanism generates yield from two sources: consensus layer rewards, paid to validators who correctly attest to blocks, and execution layer rewards, which include priority fees from users willing to pay above the base fee for transaction inclusion. The base staking yield — currently 2.8–3.5% annualised — fluctuates with network activity. High transaction volumes push priority fees up; low activity periods push the yield toward the lower end of the range. The yield is paid in ETH and is therefore subject to ETH price changes relative to the investor’s base currency.

    Liquid staking protocols — Lido, Rocket Pool, and others — allow holders to stake without running a validator node, receiving a liquid receipt token (stETH, rETH) that accrues staking rewards while remaining tradeable and useable as collateral. The yield on these protocols tracks the native staking yield with a small protocol fee deduction. The receipt token itself trades at a small discount or premium to spot ETH based on redemption queue depth and market demand.

    DeFi vaults and lending protocols using staked ETH as collateral can generate substantially higher yields by layering strategies: using stETH as collateral to borrow stablecoins, deploying those stablecoins into yield-generating positions, and recycling the returns. At 8.28% on benchmark aggregators, these strategies are not free money — they carry liquidation risk if ETH prices fall sharply relative to collateral thresholds, smart contract risk in the vault code, and protocol counterparty risk if the underlying lending market experiences stress. The 8.28% yield is real but is compensation for those risks rather than equivalent value to a 2.8% yield with lower risk exposure.

    ETHB sits at the bottom of the yield hierarchy by design. BlackRock’s staking partner operates as a professional validator with institutional infrastructure, custody insurance, and slashing protection. The 1.9–2.2% net yield reflects the native yield after the expense ratio and after the implicit cost of the custody and staking infrastructure delivering that yield with materially lower operational risk. For a pension fund trustee or a registered investment advisor managing client assets, the risk-adjusted comparison to on-chain alternatives is not obviously unfavourable — it depends on whether the advisor’s mandate and risk framework can accommodate the alternatives at all.

    What ETHB Is and Is Not

    ETHB is not a way to access Ethereum yield at the rates available on-chain. It is a way to access a portion of Ethereum’s staking yield within a regulatory and custody framework that makes it accessible to investors who would not otherwise be able to hold Ethereum. Those are different products serving different audiences, and conflating them creates misaligned expectations.

    For the investor who can hold native ETH and is comfortable operating a wallet, evaluating liquid staking protocols, and managing smart contract risk, ETHB offers lower yield for the privilege of regulatory wrapping. The product is not for them. For the investor whose mandate prohibits direct crypto holdings, whose custodian cannot hold native ETH, or who wants staking yield without the operational overhead of self-custody — ETHB delivers something they could not access otherwise.

    The more interesting question is whether ETHB’s existence changes the overall institutional allocation dynamic for Ethereum. The Bitcoin ETF experience — where institutional inflows following the January 2024 approval of spot Bitcoin ETFs were substantial and persistent — is the relevant precedent. ETH had not historically attracted the same institutional interest as Bitcoin, partly because its monetary policy is more complex, partly because its use case is harder to summarise as a single thesis, and partly because its staking mechanism was not accessible in a compliant wrapper. ETHB removes the third barrier. Whether it moves institutional interest at the scale the Bitcoin ETFs did remains to be tested.

    Why Investors Keep Misreading Staking Yields

    There is a reliable pattern in how investors encounter a new yield source: they pattern-match it to something familiar, and the match they choose tells you more about their prior experience than about the asset itself. With Ethereum staking yields, the pattern match that most institutional allocators reach for is “bond-like income.” The yield is 2.8–3.5%. It is generated by a mechanical process. It arrives regularly. It does not require active management. In a meeting note, it reads like a yield-bearing instrument, and investors file it mentally with other yield-bearing instruments.

    This is the behavioral gap. Staking yield is generated by a risk asset with a small yield offset, not by a fixed income instrument with a well-defined duration and credit profile. The 2.8–3.5% does not reduce the ETH price risk; it partially offsets it. An investor who holds ETHB and experiences a 20% decline in ETH price has not earned a yield of 2.8% — they have earned a yield of 2.8% on a position that lost 20%. The mechanical regularity of the yield reinforces the misread, because regular income in traditional finance is associated with instruments where capital stability is part of the contract. With staking, it is not.

    The comparison to competing yield sources in the stablecoin landscape — Ethena’s synthetic yields, Sky’s savings rate, Ondo’s T-bill wrapper — is clarifying precisely because those products vary enormously in their risk profiles despite similar headline yield numbers. Investors who benchmark staking yield against stablecoin yield are implicitly marking the risk profile as similar, which it is not. The stablecoin yield comparisons are useful for understanding the yield opportunity cost; they are not useful for understanding the risk profile of the ETH exposure itself. Keeping those two analytical questions separate is the behavioral discipline that most investors applying a yield-seeking framework to this space consistently fail to maintain.

    The Glamsterdam Upgrade and Its Yield Implications

    Ethereum’s Glamsterdam upgrade, expected in mid-2026, introduces changes to the execution layer that are relevant to staking yield projections. The upgrade combines EIP proposals that modify how priority fees are distributed and how validator rewards are calculated at the execution layer. The net effect on baseline staking yield is projected to be modest — analysts estimate 0.1–0.3 percentage point changes in the post-upgrade base yield — but the upgrade also enables technical improvements that are expected to increase overall network transaction volume over time by improving throughput.

    For ETHB investors, the Glamsterdam upgrade matters indirectly: higher long-run transaction volume means higher priority fee revenue means higher native staking yield, which translates into higher pass-through yield before fees. The fund’s expense ratio is fixed; the underlying yield is variable. If Glamsterdam succeeds in its throughput objectives and if Ethereum’s fee market grows proportionally, the case for ETHB’s yield relative to current projections improves over a multi-year horizon.

    The risk to that case is that throughput improvements reduce fee pressure per transaction even as total transactions increase. Ethereum’s rollup scaling strategy — which moves high-volume activity to layer-2 networks that settle periodically on the base layer — has already had this effect: L2 growth has been dramatic, but base layer fee revenue has not grown proportionally because L2 users pay much lower per-transaction fees than equivalent on-chain activity would cost. If Glamsterdam accelerates L2 adoption without proportionally increasing base layer fee revenue, the staking yield trajectory is more muted than current projections suggest.

    The ETH Price Factor

    Ethereum was trading at approximately $2,350 at the time of writing, having recovered from lows below $2,000 earlier in 2026 but remaining well below its 2021 all-time high of approximately $4,800. The yield on ETHB is denominated in ETH — meaning the dollar return to investors combines the staking yield and the ETH/USD exchange rate movement. At 2.0% staking yield and flat ETH price, the dollar return is 2.0%. At 2.0% staking yield and a 20% ETH price decline, the dollar return is approximately -18%.

    This matters for how ETHB is categorised in portfolio construction. An investor who frames ETHB as a “yield product” analogous to a bond or money market fund is making a category error. The yield is real, but the price exposure to ETH is the dominant risk factor at any realistic staking yield level. A 2.0% yield does not offset meaningful ETH price drawdown. ETHB is correctly categorised as a risk asset with a yield component — not a yield instrument with crypto exposure as a secondary feature.

    The institutional appeal of ETHB is better framed as: a compliant way to hold ETH price exposure with a small positive carry, rather than a way to earn yield from Ethereum’s network. That framing is accurate and still potentially useful — positive carry on a risk asset holding is a genuine investment advantage, all else equal. But it requires investors to accept that they are primarily taking Ethereum price risk, with staking yield as a partial offset to holding costs.

    What On-Chain Operators Should Note

    For Web3 protocols and DeFi operators, ETHB’s launch has a second-order significance beyond institutional ETH flows. Liquid staking tokens — particularly stETH — have become foundational collateral assets across DeFi. ETHB does not use LSTs; it uses BlackRock’s direct validator infrastructure. But the inflows ETHB attracts from institutional holders who would not otherwise hold staked ETH increase overall ETH price support without contributing to the LST collateral base that DeFi protocols rely on.

    This creates a mild but genuine supply dynamic: ETH locked in ETHB is ETH that is staked (removing it from circulating supply) but not represented in DeFi as liquid collateral. If ETHB grows to significant scale — say, 1–2 million ETH equivalent — the marginal effect on DeFi collateral supply versus on-chain staking alternatives is observable, though not dominant at current market sizes.

    The more immediate relevance is the signal ETHB sends to regulators and institutions about Ethereum’s maturation as an asset class. A BlackRock-issued staking product listed on Nasdaq is a stronger institutional legitimacy signal than any number of analyst reports or conference panel discussions. Whether that legitimacy translates into broader institutional adoption of Ethereum’s ecosystem — rather than just ETH price exposure — is the question that on-chain operators should watch over the next 12 months. Legitimacy at the asset level does not automatically extend to the protocol layer, but it is a prerequisite for it.

    FAQ

    What is BlackRock ETHB?
    ETHB is the iShares Ethereum Trust with staking, listed on Nasdaq in March 2026. It is the first US exchange-traded product to pass Ethereum staking yield through to shareholders. Net yield is approximately 1.9–2.2% after fees, tracking the native staking yield of 2.8–3.5% minus the fund’s expense ratio and operational costs.

    How much ETH is currently staked?
    Approximately 35.86 million ETH is staked — roughly 29.5% of total circulating supply. The staking yield is variable, currently running at 2.8–3.5% annualised, driven by consensus layer rewards and execution layer priority fees.

    Why is ETHB’s yield lower than on-chain staking alternatives?
    On-chain staking alternatives — liquid staking protocols, restaking, DeFi vaults — offer higher yields because they carry higher risks: smart contract risk, protocol counterparty risk, liquidation risk in vault strategies. ETHB’s lower yield reflects institutional-grade custody and staking infrastructure that materially reduces operational risk at the cost of yield.

    What is the Glamsterdam upgrade?
    Glamsterdam is an Ethereum network upgrade expected in mid-2026 that modifies execution layer reward distribution and improves throughput. The direct effect on staking yield is modest (0.1–0.3 percentage points), but successful throughput improvements could increase long-run fee revenue and therefore staking yields over a multi-year horizon.

    Is ETHB suitable as a yield instrument?
    ETHB is better categorised as a risk asset with positive carry than a yield instrument. The 1.9–2.2% staking yield is a partial offset to holding costs, not a return driver that offsets meaningful ETH price drawdown. Investors should treat ETH price exposure as the primary risk factor.

    Sources

  • Amateur Leadership in Web3: Why Weak Operators Keep Reproducing the Same Failures

    Amateur Leadership in Web3: Why Weak Operators Keep Reproducing the Same Failures


    TL;DR

    Web3 keeps reproducing the same organizational failures because too much of the sector is run by leaders who are stronger at narrative than at company-building. Executive tenures are short. governance is weak. capital arrives before operating discipline. When things go wrong, the explanation shifts to market conditions, regulation, or timing rather than to the predictable weaknesses in leadership quality. This is not bad luck. It is a system still too willing to fund amateur operators with professional-sounding language.


    An industry cannot harden standards if the people in charge change too often, learn too little, and keep getting rewarded for presentation over execution.


    Editorial image symbolizing the attempt to dress up weak Web3 leadership with new narrative clothing instead of fixing the underlying operating problem.

    The emperor problem in Web3 is not only product. It is leadership that keeps mistaking costume for capability.


    Disclosure: This page is editorial analysis built from the amateur-hour Web3 cluster and supported by the long-form source material on executive churn, weak diligence, and leadership failure patterns. Sources appear near the end.


    A lot of Web3 leadership looks impressive until you ask how often the same operator has actually built something durable.

    The sector is full of executives who know how to sound strategic, raise capital, and speak in the language of category transformation. What is often much weaker is the part that mature industries would treat as the actual test: staying in the seat, building operational memory, and improving a company through more than one market mood.

    This is why the Web3 professionalism problem keeps flowing back to leadership. Weak definitions, bad marketing, and fragile governance are not separate failures. They are what happens when the people at the top are not serious enough to impose better standards.


    Executive Churn Destroys Memory

    High leadership turnover is not just an HR detail. It prevents organizations from accumulating the memory required to improve. Every new executive inherits a partial story, reframes old failures as market noise, and launches a fresh narrative that usually resets accountability rather than strengthening it.

    That is one reason crypto keeps relearning the same lessons. The people responsible for preventing repetition often do not stay long enough to be judged by whether repetition happened anyway.


    Capital Often Rewards the Wrong Skill Set

    Web3 funding structures have made this worse by rewarding persuasion before proof. If capital arrives before product-market fit, operational rigor becomes easier to postpone. A leader can survive on narrative energy much longer than they could in a business where users, revenue, and governance were doing the disciplining in real time.

    That creates a dangerous selection effect. The sector keeps elevating people who are unusually good at raising attention, while underweighting the quieter operators who know how to build standards, systems, and continuity.


    Narrative-First Leadership Makes Every Other Problem Worse

    When leadership is weak, marketing becomes theater, user metrics become inflated, and governance becomes something to discuss rather than enforce. The same root cause shows up in different costumes across the organization because nobody with enough authority is insisting on harder definitions and slower truth.

    This is why amateur leadership is not just one topic among many. It is a multiplier of every other weakness in the sector.


    Professional Leadership Looks Boring by Comparison

    Professional leadership usually sounds less cinematic because it is more accountable. It stays longer. It defines terms more carefully. It is willing to let metrics look smaller if the smaller metric is real. It does not confuse fundraising or attention with proof that the business has become more durable.

    That is also why professional Web3 should look almost boring by mature-industry standards. The more exciting the narrative gets, the more discipline leadership should be imposing behind the curtain.


    Conclusion

    Amateur leadership in Web3 is not an embarrassing side issue. It is one of the main reasons the sector keeps cycling through inflated promises and preventable failures.

    An industry led by narrative-first operators will keep producing narrative-first outcomes. Until capital, boards, and teams start preferring leaders who can hold standards over leaders who mainly hold attention, Web3 will keep rediscovering the same problems with new branding.


    Sources

    The Structural Reason Web3 Keeps Promoting The Wrong People

    The amateur-leadership problem in Web3 is not a recruitment problem. It is an incentive problem hiding behind a recruitment problem. The industry has built a structure in which the skills that produce loud token-price action over a quarter are the skills that get promoted; the skills that produce durable operating performance over a five-year horizon do not get measured, do not get rewarded, and frequently do not get hired in the first place. This is not the fault of any individual hiring committee. It is what happens when the metric that determines compensation, status, and authority is something other than the metric that determines durable success.

    Look at the typical Web3 executive resume from 2021 through 2024. The pattern is consistent. Token-price-correlated marketing wins are listed first. Conference appearances and ecosystem partnership announcements form the bulk of the middle section. Actual operating roles — the kind that involve customer retention, P&L responsibility, audit relationships, regulatory liaison — are either absent or buried at the bottom in a way that suggests the candidate considers them less impressive than the noise items above them. The hiring committees that read these resumes have been trained, by their own internal compensation structures, to weight the noise items more heavily than the operating items. The candidate who gets hired is the candidate optimised for the wrong metric, and the protocol they go on to run reflects that optimisation choice.

    This is the same structural failure that consumer tech experienced in the late dot-com period, repeated with crypto-specific characteristics. The 1999-cohort consumer tech executives who became famous were the ones who could move a stock price on a quarter; the operators who actually built the businesses that survived the 2001 reset were the ones who treated the stock price as a downstream consequence of operating performance rather than the goal. The crypto industry has not yet had its 2001. When it arrives, the executives currently lauded for narrative skill will be the casualty list, and the operators who have been quietly building unfashionable operational capability will be the survivors. This is not a prediction. It is the structural geometry of every industry that has gone through a maturation cycle, and there is nothing about crypto that suggests it will be the exception.

    The interesting question for investors evaluating crypto leadership in 2026 is not “is this executive good at the visible job” but “would this executive still be employed if the visible job suddenly stopped being scored.” Most current crypto executives would not be, and they know it, which is the underlying reason the industry produces so much narrative work and so little durable operating output. The structural incentive is to keep the visible job being scored — to maintain the noise that produces the executive’s market value — at the cost of the operating work the protocol actually needs. The cure is not better hiring committees. The cure is changing what the hiring committee is paid to score.

    The cure for the amateur-leadership pattern is not subtle, and it is not happening fast because the people who would have to implement it are the same people who benefit from the current arrangement. The cure has three components, each individually doable and collectively held back by the same coordination problem.

    First, executive compensation has to be re-anchored to multi-year operating metrics rather than to token-price-correlated narrative output. This means base salary scaled to actual P&L responsibility, not to chain TVL or token market cap. It means bonus structures with three-to-five-year vesting tied to retention, gross margin, and customer-acquisition-cost ratios — the boring numbers that any consumer SaaS board has been measuring since 2010. The crypto-specific resistance to this is the argument that “tokens are different and require different metrics.” That argument has been useful to the people making it and has produced poor outcomes for the people accepting it.

    Second, board governance has to develop independent operating expertise. The typical Web3 board is composed of investors and founders, with at most one operating veteran included for credibility. The functional consequence is that boards approve executive decisions they are not technically equipped to evaluate, because nobody around the table has run the kind of business the protocol is trying to become. The cure is straightforward — add board members with prior operating roles in regulated financial services, in mature SaaS, in payments, in any sector that has been through the maturation cycle Web3 is now negotiating. The crypto-specific resistance here is the cultural preference for crypto-native leadership, which is sometimes a reasonable preference and is more often an excuse for keeping the board composition friendly.

    Third, public communication has to be re-priced. The cost of a CEO appearing on a podcast or panel and making a substantive operational claim that turns out to be false should be a substantial cost, not a routine occurrence. The current structure makes inaccurate operational claims essentially free for the executive making them, which is why so many are made and why the noise-to-signal ratio in crypto leadership communication has degraded to where it now sits. The cure is uncomfortable for the executives and indispensable for the industry: a class of crypto journalism that holds operators to operational claims and reports honestly when those claims fail to materialise. The industry has been actively starving this class of journalism through advertising decisions and access-control decisions; reversing that is a multi-year project.

    The constituency that will eventually drive these three structural changes is not yet visible inside the industry. It will probably arrive from one of two directions: a major institutional allocator that decides the existing leadership-evaluation framework is producing returns inadequate to the risk being taken, or a regulator that decides current public-communication practices in crypto rise to the level of investor-protection concern. Either source produces the same outcome — an external pressure on the executive labor market that re-prices what crypto leadership is supposed to be. The executives who have been quietly building genuine operating capability will be the ones who survive the re-pricing; the ones who built only the narrative will discover their market value was never theirs to begin with. This is the predictable outcome of every prior industry maturation cycle, and crypto is not the exception its current leadership class hopes it is.

    The forecast worth holding for any operator inside Web3 in 2026 is therefore that the next two years will sort the executive cohort more harshly than the previous two did. The sorting will not be loud. It will look like quiet leadership transitions that get reframed as “strategic pivots” and like quarterly reports that quietly stop emphasising the metrics that previously defined the executive’s value. The operators who have been building the unfashionable capability will be the ones whose calls get returned by the institutional allocators that emerge from the sorting. The operators who built only the narrative will find that the calls stop coming, and that the people who used to praise them publicly have moved on without explanation.

    The honest closing observation is that the cohort of Web3 leaders who survive the next reorganisation will not be the cohort who were most visible during the run-up. It will be the cohort who were least visible — the operators who declined to optimise for the noise and accepted the slower path of building actual operating capability. That cohort is small. It is also identifiable to anyone willing to look at the right operational signals rather than the visible communication signals.

  • Microsoft 365 Price Defense in 2026: Why Copilot Bundling Looks Like ARPU Protection as Much as Innovation

    Microsoft 365 Price Defense in 2026: Why Copilot Bundling Looks Like ARPU Protection as Much as Innovation


    TL;DR

    Microsoft 365 pricing in 2026 should be read through two lenses at once. Microsoft can credibly argue that it keeps adding capabilities across productivity, security, compliance, and Copilot-integrated workflows. But that is only half the story. The other half is structural: Microsoft owns one of the stickiest enterprise environments in the market, and rising AI-era costs create obvious pressure to defend ARPU inside that installed base. That is why the “more value” framing deserves scrutiny. In a deeply embedded suite, innovation and extraction can travel together.


    When a platform already owns the workflow, a price rise can be both defensible and directional.


    Editorial illustration of an old enterprise office setup representing the entrenched Microsoft 365 workflow stack that makes pricing increases harder for organizations to resist.

    The suite is not just software. It is the office environment many companies already built themselves around.


    Disclosure: This page is editorial analysis based on Microsoft’s official pricing communications, Work Trend messaging, and the broader VaaSBlock Microsoft squeeze thesis. Sources appear near the end.


    The simplest way to misread Microsoft 365 pricing is to assume every increase is either obviously justified or obviously cynical.

    The reality is harder. Microsoft 365 sits at the center of email, documents, meetings, identity, security, governance, compliance, and increasingly AI assistance for a huge part of enterprise work. That is a real value position. It is also an ideal place to defend revenue when the bill behind the AI story starts rising fast. Those two things can be true at the same time.

    This is the enterprise branch of the broader Microsoft AI squeeze argument. If the developer angle shows how habit can become a toll booth, the Microsoft 365 angle shows how organizational dependence can do the same thing at larger scale.


    The December 2025 Pricing Signal

    Microsoft’s December 4, 2025 pricing update is the cleanest signal in this story. The company framed the change around capability growth: more than 1,100 new features, ongoing security and compliance expansion, and Copilot integrations across the suite. That is the official defense, and it is not entirely cosmetic. The product surface really has expanded.

    But timing matters. The pricing move also landed during a phase when Microsoft was under visible pressure to show that AI-era investment would support durable monetization rather than only narrative momentum. In that context, it is reasonable to read the change not just as value-based pricing but as price defense inside an unusually captive enterprise environment.


    Why Microsoft 365 Is Such A Good Place To Defend ARPU

    Few enterprise products are as deeply woven into everyday work as Microsoft 365.

    Email, files, Teams, spreadsheets, presentations, identity, permissions, compliance settings, archives, procurement processes, and internal training are all entangled with it. That matters because switching costs are not merely technical. They are political, operational, and cultural. Migration is slow. Risk is high. Internal sponsors are cautious. Procurement teams know replacement projects can become career events for the wrong reasons.

    That kind of embed makes “price defense” more realistic. Microsoft does not need every buyer to love the increase. It only needs most of them to decide that the cost and disruption of challenging the stack feels worse than absorbing it.


    The Copilot Framing Problem

    Copilot complicates the conversation because it gives Microsoft a plausible innovation layer to bundle into the suite while paid-seat clarity still looks less visible than the usage narrative.

    Microsoft’s own Work Trend messaging emphasizes broad organizational use and AI transformation. What it does not cleanly provide is a simple public conversion read on how deeply those eligible seats are paying and sticking. That gap matters because “customers are using AI” and “customers are happily funding a new long-term price structure” are not identical claims.

    Inference from the sources: Copilot helps justify the value story, but it also helps create political cover for defending suite economics before the market has full seat-level clarity.


    Why IT Teams Read This Differently

    The average public narrative around Microsoft still leans strategic and optimistic. The enterprise buyer often reads the same situation more operationally.

    IT teams do not only hear “more capabilities.” They hear retraining costs, contract changes, support burden, overlapping tool rationalization, and another round of explaining to finance why the stack got more expensive. When that keeps recurring, the emotional tone shifts. Buyers stop hearing innovation first and start hearing nickel-and-dime behavior, even if the vendor can technically justify each individual move.

    That is why muted backlash still matters. In a product this embedded, you do not need a mass exodus for the moat to weaken. You only need trust to degrade slowly enough that every renewal conversation becomes a little less generous.


    The Price-Defense Thesis

    Microsoft 365 price defense is not a claim that Microsoft has no right to charge more. It is a claim about what type of environment makes those increases especially attractive.

    • The workflow is entrenched: migration is expensive and risky.
    • The suite is politically central: many departments are already locked into it.
    • AI costs are rising: Microsoft has more reason to defend revenue quality.
    • Copilot creates narrative cover: innovation framing softens resistance.
    • The buyer burden is fragmented: no single complaint needs to trigger a revolt.

    That is why this is better understood as strategic price defense than as a simple feature-update story.


    Conclusion

    Microsoft 365 pricing in 2026 is best read as a test of how much monetization pressure the installed base can absorb while the company scales the AI era. The suite is strong enough to support a real value argument. It is also sticky enough to support behavior that looks increasingly extractive if value proof lags.

    That is the nuance people keep missing. Microsoft does not need to be weak for the warning to matter. In fact, the warning matters precisely because the moat is so strong. Price defense becomes most tempting when customers are trapped by the same workflow depth that made the platform valuable in the first place.


    Sources

    The Product-Strategy Read On Microsoft’s 365 Pricing Defense

    The Microsoft 365 pricing defense is interesting to a product-strategy practitioner because it sits at the intersection of three product decisions that most companies handle separately and Microsoft has chosen to handle as a single system. The first is bundle composition: what goes into the package and what stays out. The second is value attribution: which component is the customer paying for, in their own perception, and which components are perceived as included. The third is price elasticity by segment: how much each customer segment will absorb before the conversion to cancellation accelerates.

    The way Microsoft has integrated these three decisions is unusual. Most enterprise software vendors run the bundle composition as an annual exercise, the value attribution as a marketing exercise, and the price elasticity as a finance exercise. Each decision is made by a different team, optimised against a different metric, and the cumulative effect on customer perception is whatever happens to emerge. Microsoft has, by contrast, treated the three as facets of one product decision, with a single team responsible for the cumulative customer outcome. The result is a pricing system that holds together internally in a way that most competitor pricing systems do not, and that explains why the 365 price defense has been more successful than the equivalent exercises at Google Workspace or at the various standalone office suites that have tried to displace it.

    The Copilot bundling decision specifically is the part of the system that will be tested over the next four quarters. The decision treats Copilot as an integrated value component rather than as a standalone purchase, which means the customer who would not have bought Copilot at its standalone price has been migrated into a tier where they are paying for it whether they use it or not. The product-strategy bet is that the integrated value is real, the bundled price will be absorbed as a normal renewal increase, and the Copilot capability will deepen the customer’s investment in the broader Microsoft toolchain over time. The product-strategy risk is the inverse — that customers perceive the increase as a bundling tax, that the perception triggers procurement-team scrutiny of the overall renewal, and that the scrutiny leads to budget reductions on other Microsoft line items that would have grown otherwise.

    Both outcomes are plausible. The data that would distinguish between them is the renewal-by-renewal trajectory of customers above a specific seat count, where procurement-team involvement is high enough that the bundling decision is examined explicitly. Microsoft’s own analytics team knows what this data shows. The market does not yet, and will not for several quarters. The bet the company has made is that the integrated value is sufficient that even when the bundling is examined explicitly, the conclusion of the examination is to renew. The bet the company has not made — the bet a more conservative product team might have made — is to ship Copilot as a true opt-in line item that customers actively choose, accepting lower attach rates in exchange for a cleaner customer-perception trajectory.

    The next eight quarters will reveal which bet was correct. If renewal rates hold and the customer-satisfaction surveys do not deteriorate, the integrated-bundle bet wins and Microsoft has captured the AI transition value in the most efficient possible way. If renewal rates hold but customer-satisfaction softens, the win was partial and the company has accumulated repair work for the cycle after this one. If renewal rates deteriorate, the bet was too aggressive and the price defense will need to be partially walked back. The probability mass across these three outcomes is exactly where the consensus is mispricing Microsoft, and the customer-segment data that would shift the mass is the data nobody outside the company will see until the company’s own quarterly reporting reveals which direction the data moved.

    What this means in practice for any enterprise customer evaluating the Microsoft 365 renewal in 2026 is that the procurement-team conversation has shifted in a specific way. The line item that used to be reviewed mechanically — “Microsoft 365, prior price plus the standard renewal increment” — is now reviewed substantively, because the bundling decision has surfaced questions that the prior line-item review did not surface. The questions are: which features in the bundle are we actually using, what is our realised value from Copilot specifically, what would the cost be of moving the workload off Microsoft. The questions themselves are healthy. Most enterprise procurement teams should have been asking them for years and were not, because the prior renewal cadence did not require it. Microsoft’s bundling decision has, almost as a side effect, taught the customer base to ask the questions. Whether the customer base concludes from the questions that the bundle is worth it or that it is not is the part the company cannot control. The company can only have made the answer as favourable as possible by ensuring the realised Copilot value is high in the customers most likely to ask the questions. The internal data Microsoft has on this is the data the rest of us cannot see, and the bet is being made on that data even though the market is pricing it without the data.

    The eight-quarter window starts now. The interpretation will arrive in pieces.

    The question worth asking before the data arrives is which side of the trade you want to be on, and what evidence would change your mind.